Immigrants from Guatemala vs Immigrants from Northern Africa Child Poverty Among Boys Under 16
COMPARE
Immigrants from Guatemala
Immigrants from Northern Africa
Child Poverty Among Boys Under 16
Child Poverty Among Boys Under 16 Comparison
Immigrants from Guatemala
Immigrants from Northern Africa
21.6%
CHILD POVERTY AMONG BOYS UNDER 16
0.0/ 100
METRIC RATING
312th/ 347
METRIC RANK
16.0%
CHILD POVERTY AMONG BOYS UNDER 16
71.3/ 100
METRIC RATING
160th/ 347
METRIC RANK
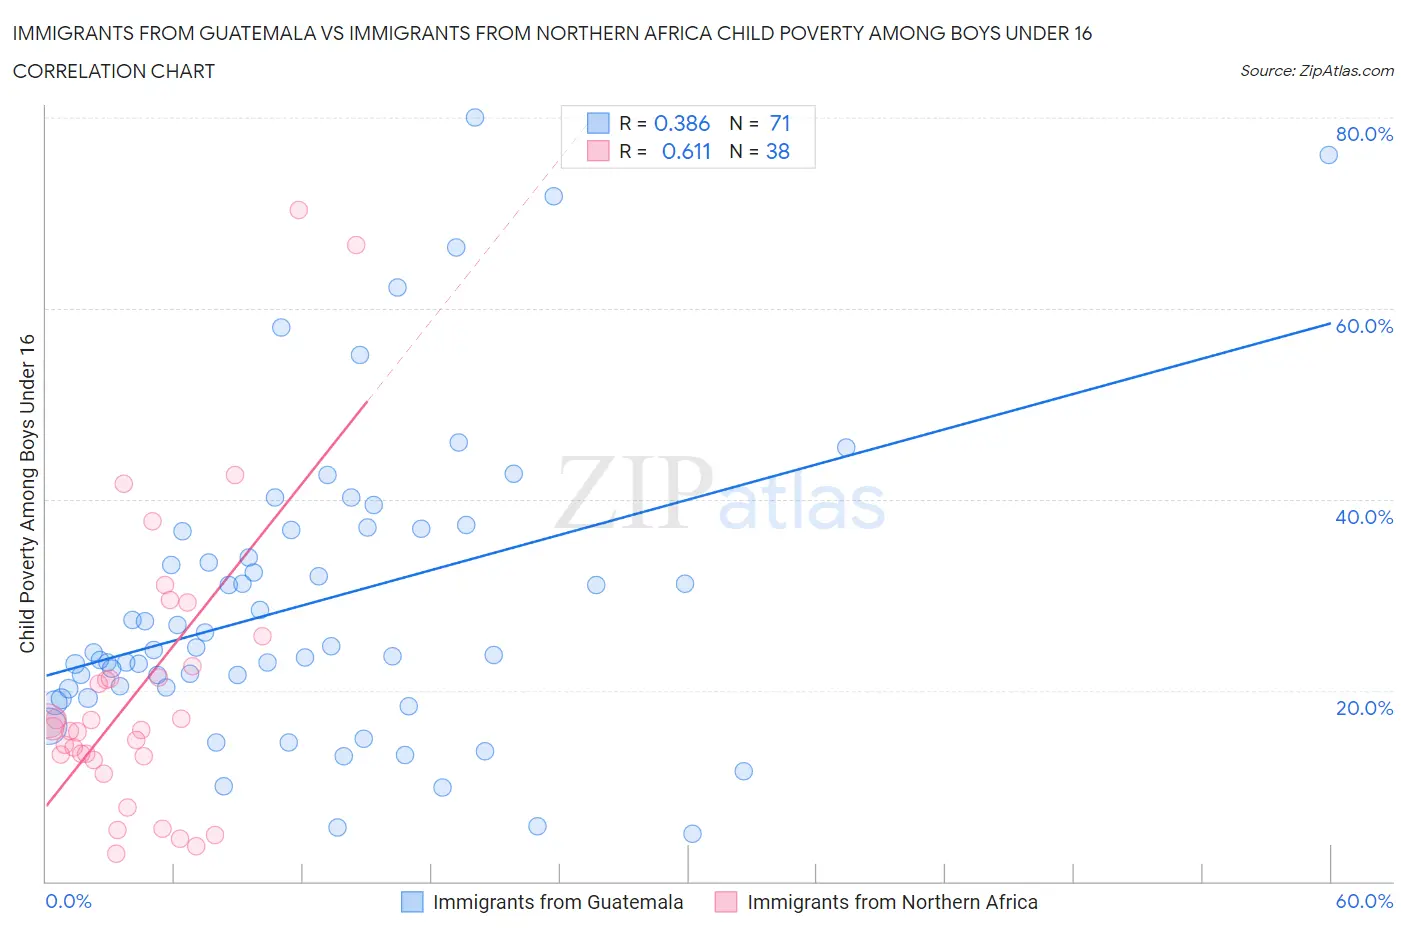
Immigrants from Guatemala vs Immigrants from Northern Africa Child Poverty Among Boys Under 16 Correlation Chart
The statistical analysis conducted on geographies consisting of 373,274,395 people shows a mild positive correlation between the proportion of Immigrants from Guatemala and poverty level among boys under the age of 16 in the United States with a correlation coefficient (R) of 0.386 and weighted average of 21.6%. Similarly, the statistical analysis conducted on geographies consisting of 317,001,959 people shows a significant positive correlation between the proportion of Immigrants from Northern Africa and poverty level among boys under the age of 16 in the United States with a correlation coefficient (R) of 0.611 and weighted average of 16.0%, a difference of 34.7%.
Child Poverty Among Boys Under 16 Correlation Summary
| Measurement | Immigrants from Guatemala | Immigrants from Northern Africa |
| Minimum | 5.0% | 2.9% |
| Maximum | 80.0% | 70.3% |
| Range | 75.0% | 67.5% |
| Mean | 29.2% | 20.2% |
| Median | 24.3% | 15.9% |
| Interquartile 25% (IQ1) | 20.2% | 13.1% |
| Interquartile 75% (IQ3) | 36.8% | 22.5% |
| Interquartile Range (IQR) | 16.6% | 9.4% |
| Standard Deviation (Sample) | 16.0% | 15.1% |
| Standard Deviation (Population) | 15.9% | 14.9% |
Similar Demographics by Child Poverty Among Boys Under 16
Demographics Similar to Immigrants from Guatemala by Child Poverty Among Boys Under 16
In terms of child poverty among boys under 16, the demographic groups most similar to Immigrants from Guatemala are British West Indian (21.6%, a difference of 0.0%), Ute (21.6%, a difference of 0.020%), Bahamian (21.6%, a difference of 0.080%), Creek (21.5%, a difference of 0.19%), and Seminole (21.5%, a difference of 0.25%).
| Demographics | Rating | Rank | Child Poverty Among Boys Under 16 |
| Kiowa | 0.0 /100 | #305 | Tragic 21.3% |
| Immigrants | Grenada | 0.0 /100 | #306 | Tragic 21.3% |
| Choctaw | 0.0 /100 | #307 | Tragic 21.3% |
| Immigrants | Mexico | 0.0 /100 | #308 | Tragic 21.5% |
| Seminole | 0.0 /100 | #309 | Tragic 21.5% |
| Creek | 0.0 /100 | #310 | Tragic 21.5% |
| Bahamians | 0.0 /100 | #311 | Tragic 21.6% |
| Immigrants | Guatemala | 0.0 /100 | #312 | Tragic 21.6% |
| British West Indians | 0.0 /100 | #313 | Tragic 21.6% |
| Ute | 0.0 /100 | #314 | Tragic 21.6% |
| Immigrants | Somalia | 0.0 /100 | #315 | Tragic 21.7% |
| Menominee | 0.0 /100 | #316 | Tragic 21.7% |
| Africans | 0.0 /100 | #317 | Tragic 21.7% |
| Yakama | 0.0 /100 | #318 | Tragic 21.7% |
| Dutch West Indians | 0.0 /100 | #319 | Tragic 21.8% |
Demographics Similar to Immigrants from Northern Africa by Child Poverty Among Boys Under 16
In terms of child poverty among boys under 16, the demographic groups most similar to Immigrants from Northern Africa are Immigrants from Oceania (16.0%, a difference of 0.010%), Guamanian/Chamorro (16.1%, a difference of 0.24%), Costa Rican (16.1%, a difference of 0.44%), Immigrants from Albania (16.1%, a difference of 0.46%), and Immigrants from Chile (15.9%, a difference of 0.51%).
| Demographics | Rating | Rank | Child Poverty Among Boys Under 16 |
| French | 78.7 /100 | #153 | Good 15.8% |
| Syrians | 77.5 /100 | #154 | Good 15.9% |
| French Canadians | 76.6 /100 | #155 | Good 15.9% |
| Israelis | 76.5 /100 | #156 | Good 15.9% |
| Immigrants | Nepal | 76.0 /100 | #157 | Good 15.9% |
| Yugoslavians | 75.9 /100 | #158 | Good 15.9% |
| Immigrants | Chile | 74.8 /100 | #159 | Good 15.9% |
| Immigrants | Northern Africa | 71.3 /100 | #160 | Good 16.0% |
| Immigrants | Oceania | 71.3 /100 | #161 | Good 16.0% |
| Guamanians/Chamorros | 69.6 /100 | #162 | Good 16.1% |
| Costa Ricans | 68.1 /100 | #163 | Good 16.1% |
| Immigrants | Albania | 67.9 /100 | #164 | Good 16.1% |
| Colombians | 65.2 /100 | #165 | Good 16.1% |
| Immigrants | Germany | 63.6 /100 | #166 | Good 16.2% |
| Afghans | 55.4 /100 | #167 | Average 16.3% |