Immigrants from Nigeria vs South American Indian Child Poverty Under the Age of 16
COMPARE
Immigrants from Nigeria
South American Indian
Child Poverty Under the Age of 16
Child Poverty Under the Age of 16 Comparison
Immigrants from Nigeria
South American Indians
18.4%
CHILD POVERTY UNDER THE AGE OF 16
1.0/ 100
METRIC RATING
234th/ 347
METRIC RANK
16.4%
CHILD POVERTY UNDER THE AGE OF 16
41.8/ 100
METRIC RATING
180th/ 347
METRIC RANK
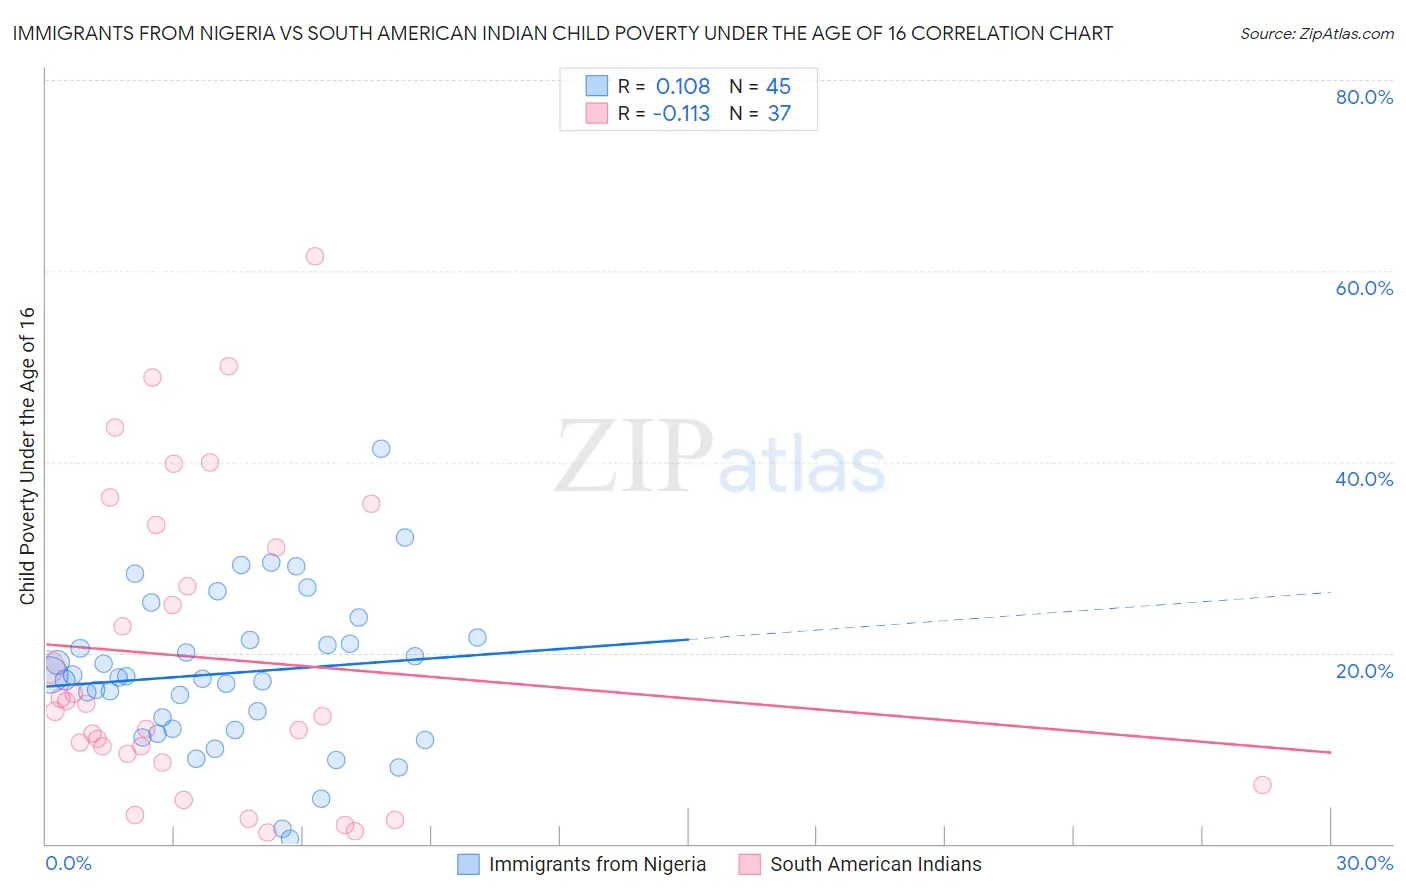
Immigrants from Nigeria vs South American Indian Child Poverty Under the Age of 16 Correlation Chart
The statistical analysis conducted on geographies consisting of 282,103,392 people shows a poor positive correlation between the proportion of Immigrants from Nigeria and poverty level among children under the age of 16 in the United States with a correlation coefficient (R) of 0.108 and weighted average of 18.4%. Similarly, the statistical analysis conducted on geographies consisting of 164,199,892 people shows a poor negative correlation between the proportion of South American Indians and poverty level among children under the age of 16 in the United States with a correlation coefficient (R) of -0.113 and weighted average of 16.4%, a difference of 12.6%.
Child Poverty Under the Age of 16 Correlation Summary
| Measurement | Immigrants from Nigeria | South American Indian |
| Minimum | 0.58% | 1.2% |
| Maximum | 41.3% | 61.5% |
| Range | 40.8% | 60.3% |
| Mean | 17.8% | 19.4% |
| Median | 17.4% | 13.9% |
| Interquartile 25% (IQ1) | 12.0% | 9.0% |
| Interquartile 75% (IQ3) | 21.5% | 32.2% |
| Interquartile Range (IQR) | 9.5% | 23.2% |
| Standard Deviation (Sample) | 8.1% | 15.8% |
| Standard Deviation (Population) | 8.0% | 15.6% |
Similar Demographics by Child Poverty Under the Age of 16
Demographics Similar to Immigrants from Nigeria by Child Poverty Under the Age of 16
In terms of child poverty under the age of 16, the demographic groups most similar to Immigrants from Nigeria are Nigerian (18.4%, a difference of 0.060%), Fijian (18.4%, a difference of 0.25%), Cree (18.5%, a difference of 0.35%), Sudanese (18.5%, a difference of 0.38%), and American (18.3%, a difference of 0.47%).
| Demographics | Rating | Rank | Child Poverty Under the Age of 16 |
| Immigrants | Africa | 2.5 /100 | #227 | Tragic 18.0% |
| Immigrants | Micronesia | 2.3 /100 | #228 | Tragic 18.0% |
| Marshallese | 1.8 /100 | #229 | Tragic 18.1% |
| Nepalese | 1.7 /100 | #230 | Tragic 18.2% |
| Nicaraguans | 1.7 /100 | #231 | Tragic 18.2% |
| Americans | 1.2 /100 | #232 | Tragic 18.3% |
| Fijians | 1.1 /100 | #233 | Tragic 18.4% |
| Immigrants | Nigeria | 1.0 /100 | #234 | Tragic 18.4% |
| Nigerians | 1.0 /100 | #235 | Tragic 18.4% |
| Cree | 0.9 /100 | #236 | Tragic 18.5% |
| Sudanese | 0.9 /100 | #237 | Tragic 18.5% |
| Immigrants | Eritrea | 0.8 /100 | #238 | Tragic 18.5% |
| Immigrants | Sudan | 0.8 /100 | #239 | Tragic 18.5% |
| Ghanaians | 0.8 /100 | #240 | Tragic 18.6% |
| Alsatians | 0.7 /100 | #241 | Tragic 18.6% |
Demographics Similar to South American Indians by Child Poverty Under the Age of 16
In terms of child poverty under the age of 16, the demographic groups most similar to South American Indians are Immigrants from Syria (16.4%, a difference of 0.050%), Immigrants from Ethiopia (16.4%, a difference of 0.060%), Immigrants from South America (16.4%, a difference of 0.12%), Ethiopian (16.3%, a difference of 0.19%), and Hawaiian (16.4%, a difference of 0.45%).
| Demographics | Rating | Rank | Child Poverty Under the Age of 16 |
| Immigrants | Saudi Arabia | 52.1 /100 | #173 | Average 16.2% |
| Whites/Caucasians | 50.0 /100 | #174 | Average 16.2% |
| Scotch-Irish | 47.1 /100 | #175 | Average 16.3% |
| Lebanese | 45.9 /100 | #176 | Average 16.3% |
| Ethiopians | 43.4 /100 | #177 | Average 16.3% |
| Immigrants | Ethiopia | 42.3 /100 | #178 | Average 16.4% |
| Immigrants | Syria | 42.3 /100 | #179 | Average 16.4% |
| South American Indians | 41.8 /100 | #180 | Average 16.4% |
| Immigrants | South America | 40.8 /100 | #181 | Average 16.4% |
| Hawaiians | 38.2 /100 | #182 | Fair 16.4% |
| Celtics | 38.2 /100 | #183 | Fair 16.4% |
| Immigrants | Western Asia | 38.0 /100 | #184 | Fair 16.4% |
| Immigrants | Bosnia and Herzegovina | 37.4 /100 | #185 | Fair 16.5% |
| Kenyans | 34.1 /100 | #186 | Fair 16.5% |
| Arabs | 31.4 /100 | #187 | Fair 16.6% |