Immigrants from Uganda vs Scottish Child Poverty Under the Age of 16
COMPARE
Immigrants from Uganda
Scottish
Child Poverty Under the Age of 16
Child Poverty Under the Age of 16 Comparison
Immigrants from Uganda
Scottish
16.8%
CHILD POVERTY UNDER THE AGE OF 16
22.5/ 100
METRIC RATING
195th/ 347
METRIC RANK
15.0%
CHILD POVERTY UNDER THE AGE OF 16
92.3/ 100
METRIC RATING
119th/ 347
METRIC RANK
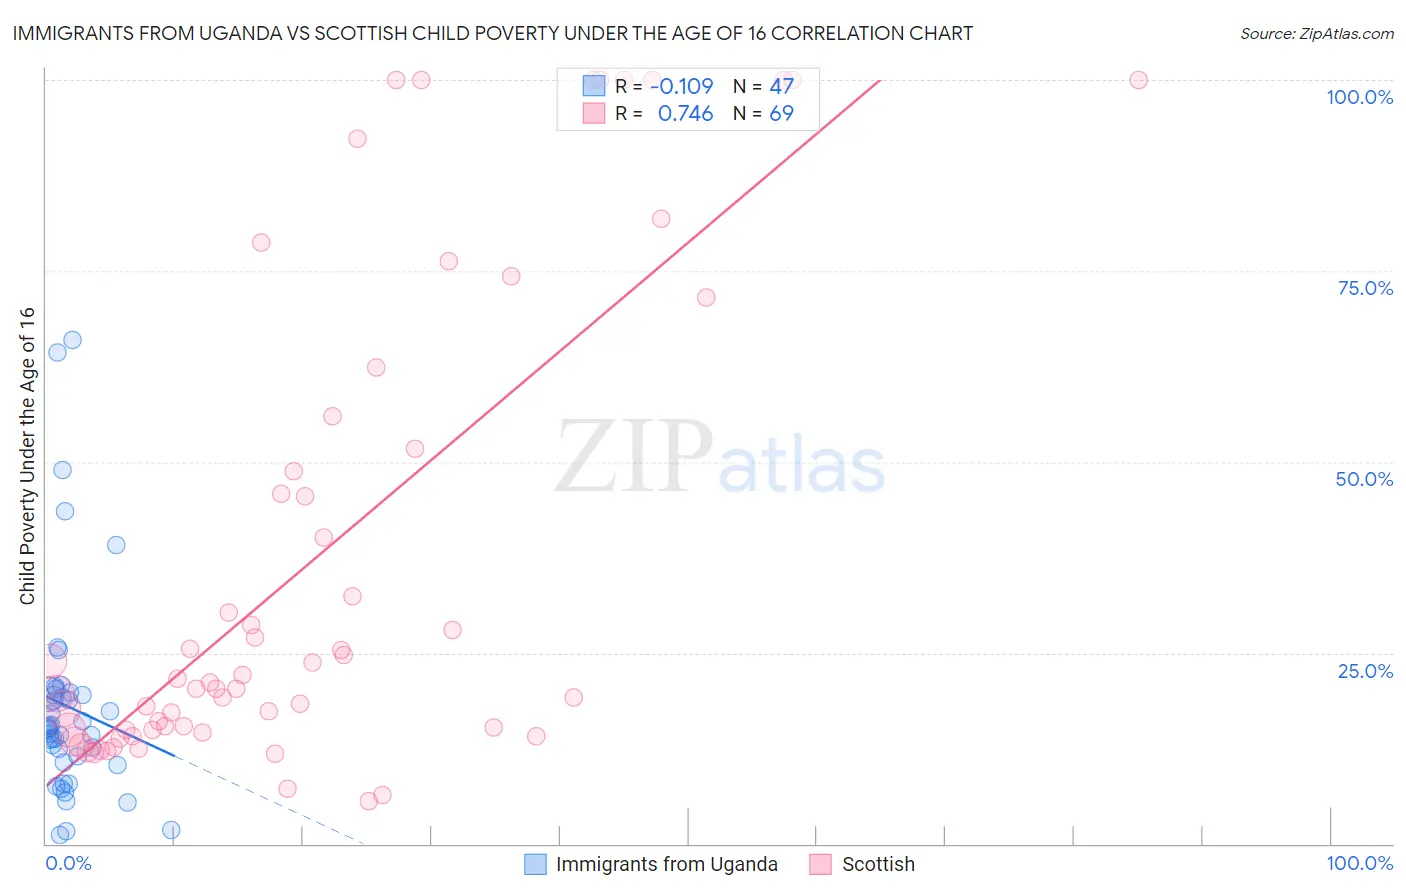
Immigrants from Uganda vs Scottish Child Poverty Under the Age of 16 Correlation Chart
The statistical analysis conducted on geographies consisting of 125,688,458 people shows a poor negative correlation between the proportion of Immigrants from Uganda and poverty level among children under the age of 16 in the United States with a correlation coefficient (R) of -0.109 and weighted average of 16.8%. Similarly, the statistical analysis conducted on geographies consisting of 554,294,508 people shows a strong positive correlation between the proportion of Scottish and poverty level among children under the age of 16 in the United States with a correlation coefficient (R) of 0.746 and weighted average of 15.0%, a difference of 12.1%.
Child Poverty Under the Age of 16 Correlation Summary
| Measurement | Immigrants from Uganda | Scottish |
| Minimum | 1.2% | 5.6% |
| Maximum | 66.0% | 100.0% |
| Range | 64.8% | 94.4% |
| Mean | 17.9% | 37.1% |
| Median | 15.1% | 21.1% |
| Interquartile 25% (IQ1) | 10.7% | 14.9% |
| Interquartile 75% (IQ3) | 19.6% | 53.8% |
| Interquartile Range (IQR) | 8.9% | 38.9% |
| Standard Deviation (Sample) | 13.8% | 31.5% |
| Standard Deviation (Population) | 13.6% | 31.2% |
Similar Demographics by Child Poverty Under the Age of 16
Demographics Similar to Immigrants from Uganda by Child Poverty Under the Age of 16
In terms of child poverty under the age of 16, the demographic groups most similar to Immigrants from Uganda are Immigrants from Lebanon (16.8%, a difference of 0.080%), Immigrants from Uruguay (16.8%, a difference of 0.090%), Spaniard (16.8%, a difference of 0.11%), Spanish (16.7%, a difference of 0.31%), and Immigrants from Kenya (16.9%, a difference of 0.60%).
| Demographics | Rating | Rank | Child Poverty Under the Age of 16 |
| Immigrants | Morocco | 31.2 /100 | #188 | Fair 16.6% |
| Immigrants | Portugal | 30.0 /100 | #189 | Fair 16.6% |
| Immigrants | Costa Rica | 29.6 /100 | #190 | Fair 16.6% |
| Immigrants | Iraq | 28.3 /100 | #191 | Fair 16.7% |
| Spanish | 24.5 /100 | #192 | Fair 16.7% |
| Spaniards | 23.2 /100 | #193 | Fair 16.8% |
| Immigrants | Uruguay | 23.1 /100 | #194 | Fair 16.8% |
| Immigrants | Uganda | 22.5 /100 | #195 | Fair 16.8% |
| Immigrants | Lebanon | 22.0 /100 | #196 | Fair 16.8% |
| Immigrants | Kenya | 19.1 /100 | #197 | Poor 16.9% |
| Delaware | 17.1 /100 | #198 | Poor 17.0% |
| Immigrants | Afghanistan | 15.1 /100 | #199 | Poor 17.0% |
| Immigrants | Cameroon | 14.7 /100 | #200 | Poor 17.1% |
| Immigrants | Uzbekistan | 14.7 /100 | #201 | Poor 17.1% |
| Ugandans | 14.3 /100 | #202 | Poor 17.1% |
Demographics Similar to Scottish by Child Poverty Under the Age of 16
In terms of child poverty under the age of 16, the demographic groups most similar to Scottish are South African (15.0%, a difference of 0.090%), Immigrants from Zimbabwe (15.0%, a difference of 0.090%), Immigrants from Malaysia (15.0%, a difference of 0.15%), Immigrants from Norway (15.0%, a difference of 0.21%), and Pakistani (15.0%, a difference of 0.29%).
| Demographics | Rating | Rank | Child Poverty Under the Age of 16 |
| Irish | 93.4 /100 | #112 | Exceptional 14.9% |
| Belgians | 93.3 /100 | #113 | Exceptional 14.9% |
| Sri Lankans | 93.2 /100 | #114 | Exceptional 14.9% |
| Immigrants | Ukraine | 93.1 /100 | #115 | Exceptional 14.9% |
| Carpatho Rusyns | 93.1 /100 | #116 | Exceptional 14.9% |
| Immigrants | Norway | 92.8 /100 | #117 | Exceptional 15.0% |
| Immigrants | Malaysia | 92.6 /100 | #118 | Exceptional 15.0% |
| Scottish | 92.3 /100 | #119 | Exceptional 15.0% |
| South Africans | 92.1 /100 | #120 | Exceptional 15.0% |
| Immigrants | Zimbabwe | 92.1 /100 | #121 | Exceptional 15.0% |
| Pakistanis | 91.7 /100 | #122 | Exceptional 15.0% |
| Immigrants | Brazil | 91.1 /100 | #123 | Exceptional 15.1% |
| Czechoslovakians | 91.0 /100 | #124 | Exceptional 15.1% |
| Palestinians | 90.9 /100 | #125 | Exceptional 15.1% |
| Portuguese | 90.6 /100 | #126 | Exceptional 15.1% |