Ghanaian vs Immigrants from Spain Single Male Poverty
COMPARE
Ghanaian
Immigrants from Spain
Single Male Poverty
Single Male Poverty Comparison
Ghanaians
Immigrants from Spain
13.3%
SINGLE MALE POVERTY
6.1/ 100
METRIC RATING
230th/ 347
METRIC RANK
12.7%
SINGLE MALE POVERTY
68.7/ 100
METRIC RATING
155th/ 347
METRIC RANK
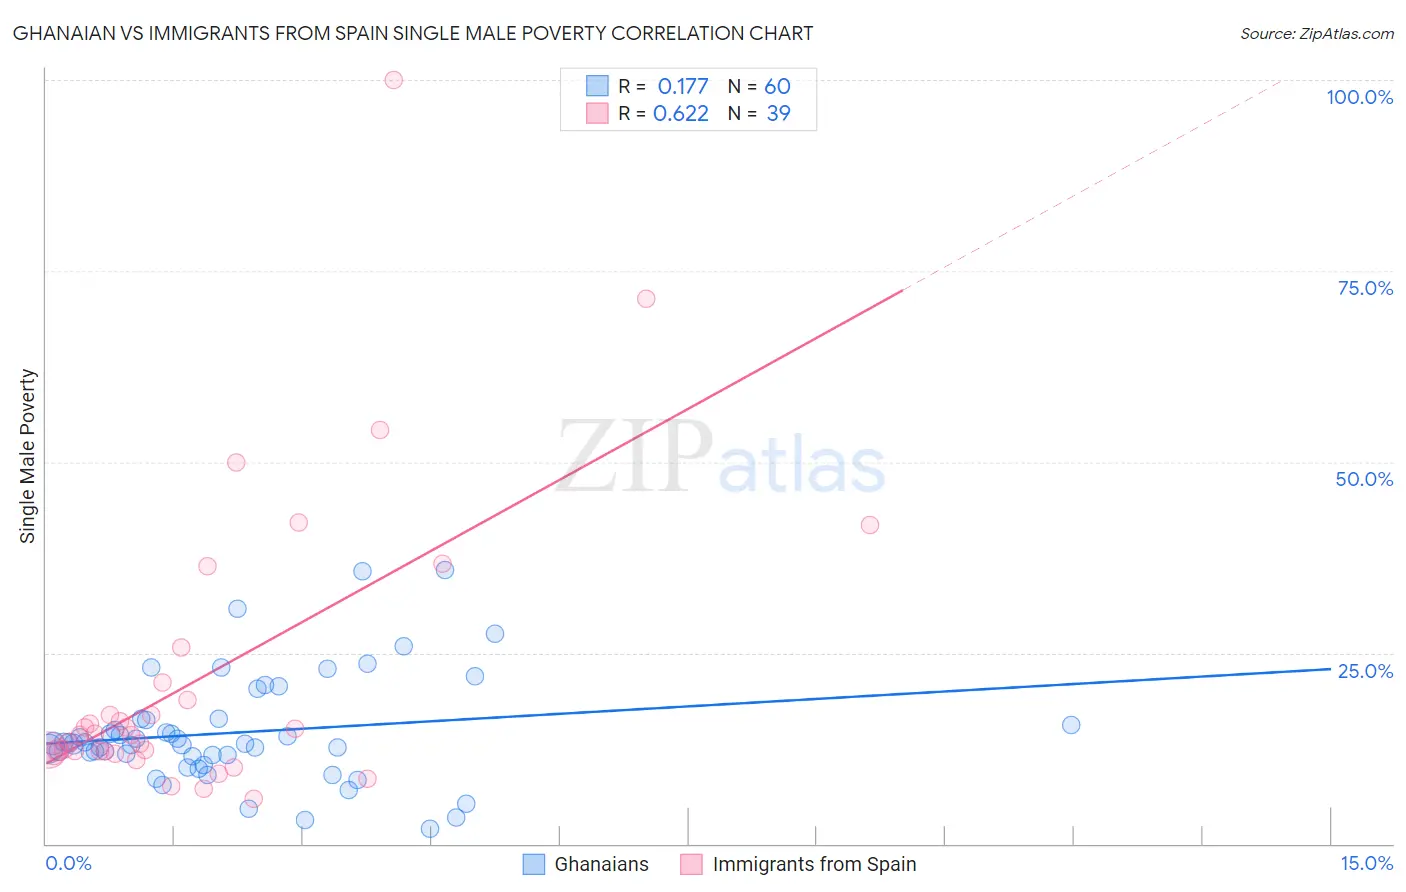
Ghanaian vs Immigrants from Spain Single Male Poverty Correlation Chart
The statistical analysis conducted on geographies consisting of 177,869,684 people shows a poor positive correlation between the proportion of Ghanaians and poverty level among single males in the United States with a correlation coefficient (R) of 0.177 and weighted average of 13.3%. Similarly, the statistical analysis conducted on geographies consisting of 219,998,655 people shows a significant positive correlation between the proportion of Immigrants from Spain and poverty level among single males in the United States with a correlation coefficient (R) of 0.622 and weighted average of 12.7%, a difference of 4.7%.
Single Male Poverty Correlation Summary
| Measurement | Ghanaian | Immigrants from Spain |
| Minimum | 2.0% | 5.9% |
| Maximum | 35.8% | 100.0% |
| Range | 33.9% | 94.1% |
| Mean | 14.5% | 21.7% |
| Median | 13.1% | 14.2% |
| Interquartile 25% (IQ1) | 11.5% | 12.1% |
| Interquartile 75% (IQ3) | 16.3% | 21.0% |
| Interquartile Range (IQR) | 4.8% | 9.0% |
| Standard Deviation (Sample) | 7.0% | 19.4% |
| Standard Deviation (Population) | 7.0% | 19.2% |
Similar Demographics by Single Male Poverty
Demographics Similar to Ghanaians by Single Male Poverty
In terms of single male poverty, the demographic groups most similar to Ghanaians are European (13.3%, a difference of 0.030%), Lebanese (13.2%, a difference of 0.12%), Slavic (13.3%, a difference of 0.18%), Haitian (13.2%, a difference of 0.20%), and Immigrants from Caribbean (13.3%, a difference of 0.27%).
| Demographics | Rating | Rank | Single Male Poverty |
| Immigrants | Azores | 9.3 /100 | #223 | Tragic 13.2% |
| Somalis | 9.1 /100 | #224 | Tragic 13.2% |
| Immigrants | Denmark | 8.7 /100 | #225 | Tragic 13.2% |
| Jamaicans | 7.7 /100 | #226 | Tragic 13.2% |
| Haitians | 7.0 /100 | #227 | Tragic 13.2% |
| Lebanese | 6.6 /100 | #228 | Tragic 13.2% |
| Europeans | 6.2 /100 | #229 | Tragic 13.3% |
| Ghanaians | 6.1 /100 | #230 | Tragic 13.3% |
| Slavs | 5.3 /100 | #231 | Tragic 13.3% |
| Immigrants | Caribbean | 5.0 /100 | #232 | Tragic 13.3% |
| British | 4.0 /100 | #233 | Tragic 13.3% |
| Canadians | 4.0 /100 | #234 | Tragic 13.3% |
| Bangladeshis | 3.7 /100 | #235 | Tragic 13.3% |
| Luxembourgers | 3.6 /100 | #236 | Tragic 13.4% |
| British West Indians | 3.4 /100 | #237 | Tragic 13.4% |
Demographics Similar to Immigrants from Spain by Single Male Poverty
In terms of single male poverty, the demographic groups most similar to Immigrants from Spain are Immigrants from Scotland (12.7%, a difference of 0.020%), Vietnamese (12.7%, a difference of 0.040%), Latvian (12.7%, a difference of 0.040%), Immigrants (12.7%, a difference of 0.090%), and Australian (12.6%, a difference of 0.17%).
| Demographics | Rating | Rank | Single Male Poverty |
| Yugoslavians | 73.9 /100 | #148 | Good 12.6% |
| Sierra Leoneans | 73.0 /100 | #149 | Good 12.6% |
| Immigrants | Panama | 72.1 /100 | #150 | Good 12.6% |
| Immigrants | Hungary | 71.9 /100 | #151 | Good 12.6% |
| Australians | 71.4 /100 | #152 | Good 12.6% |
| Immigrants | Immigrants | 70.1 /100 | #153 | Good 12.7% |
| Immigrants | Scotland | 68.9 /100 | #154 | Good 12.7% |
| Immigrants | Spain | 68.7 /100 | #155 | Good 12.7% |
| Vietnamese | 67.9 /100 | #156 | Good 12.7% |
| Latvians | 67.9 /100 | #157 | Good 12.7% |
| Immigrants | Middle Africa | 64.9 /100 | #158 | Good 12.7% |
| Immigrants | Liberia | 64.2 /100 | #159 | Good 12.7% |
| Greeks | 64.1 /100 | #160 | Good 12.7% |
| Immigrants | Africa | 63.4 /100 | #161 | Good 12.7% |
| Eastern Europeans | 63.3 /100 | #162 | Good 12.7% |