Pueblo vs Estonian Child Poverty Among Boys Under 16
COMPARE
Pueblo
Estonian
Child Poverty Among Boys Under 16
Child Poverty Among Boys Under 16 Comparison
Pueblo
Estonians
23.5%
CHILD POVERTY AMONG BOYS UNDER 16
0.0/ 100
METRIC RATING
328th/ 347
METRIC RANK
14.1%
CHILD POVERTY AMONG BOYS UNDER 16
99.4/ 100
METRIC RATING
44th/ 347
METRIC RANK
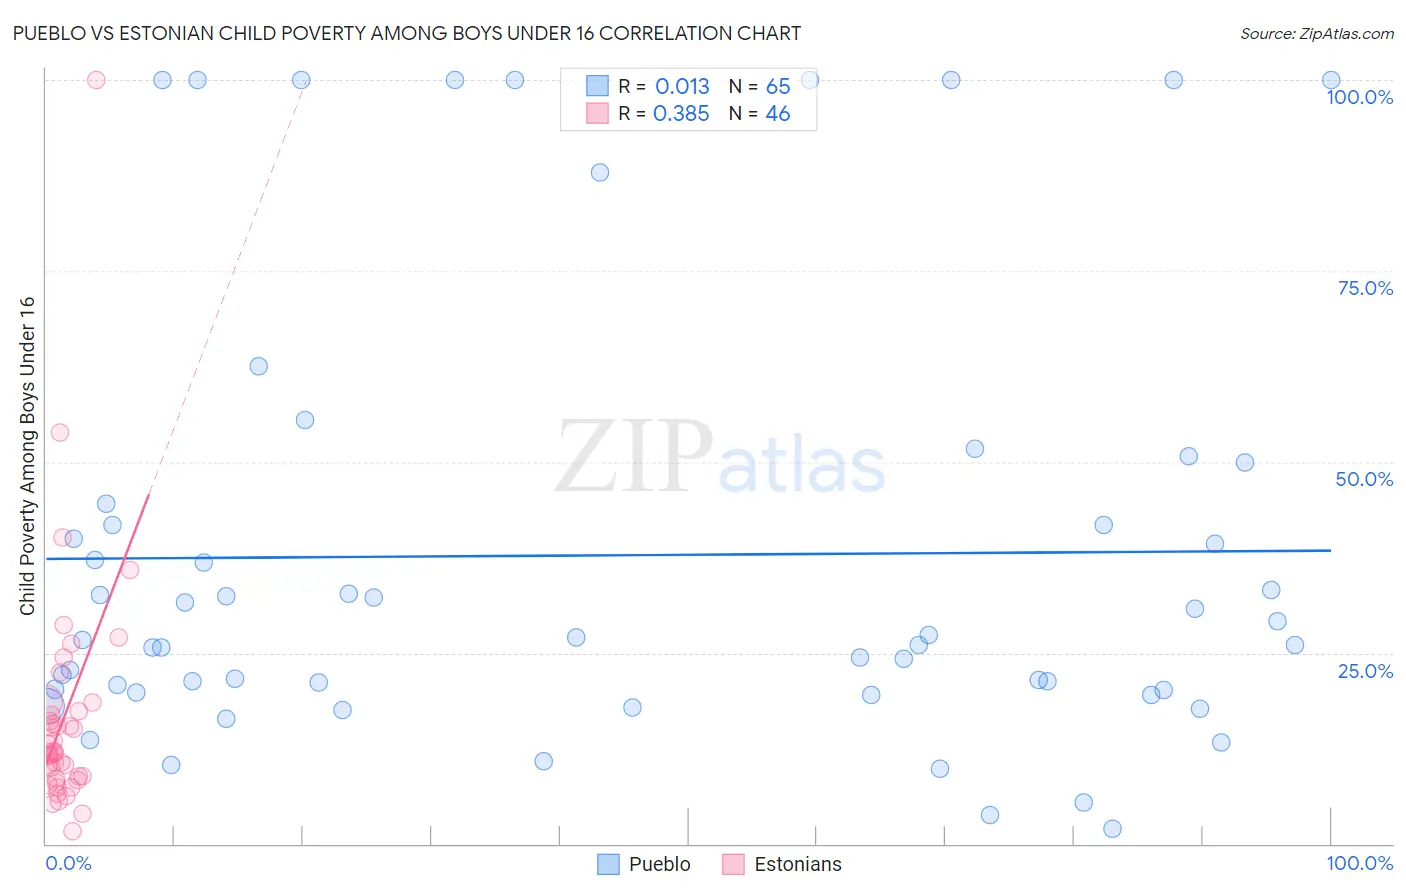
Pueblo vs Estonian Child Poverty Among Boys Under 16 Correlation Chart
The statistical analysis conducted on geographies consisting of 119,570,192 people shows no correlation between the proportion of Pueblo and poverty level among boys under the age of 16 in the United States with a correlation coefficient (R) of 0.013 and weighted average of 23.5%. Similarly, the statistical analysis conducted on geographies consisting of 122,063,894 people shows a mild positive correlation between the proportion of Estonians and poverty level among boys under the age of 16 in the United States with a correlation coefficient (R) of 0.385 and weighted average of 14.1%, a difference of 67.3%.
Child Poverty Among Boys Under 16 Correlation Summary
| Measurement | Pueblo | Estonian |
| Minimum | 2.0% | 1.7% |
| Maximum | 100.0% | 100.0% |
| Range | 98.0% | 98.3% |
| Mean | 37.8% | 16.6% |
| Median | 26.7% | 12.0% |
| Interquartile 25% (IQ1) | 20.0% | 8.4% |
| Interquartile 75% (IQ3) | 43.2% | 17.4% |
| Interquartile Range (IQR) | 23.2% | 9.0% |
| Standard Deviation (Sample) | 28.8% | 16.0% |
| Standard Deviation (Population) | 28.6% | 15.8% |
Similar Demographics by Child Poverty Among Boys Under 16
Demographics Similar to Pueblo by Child Poverty Among Boys Under 16
In terms of child poverty among boys under 16, the demographic groups most similar to Pueblo are Native/Alaskan (24.0%, a difference of 1.9%), Colville (24.1%, a difference of 2.5%), Dominican (24.2%, a difference of 2.8%), Immigrants from Honduras (22.8%, a difference of 3.2%), and Paiute (22.8%, a difference of 3.3%).
| Demographics | Rating | Rank | Child Poverty Among Boys Under 16 |
| Cajuns | 0.0 /100 | #321 | Tragic 22.2% |
| Immigrants | Dominica | 0.0 /100 | #322 | Tragic 22.2% |
| Hondurans | 0.0 /100 | #323 | Tragic 22.3% |
| Immigrants | Congo | 0.0 /100 | #324 | Tragic 22.4% |
| Central American Indians | 0.0 /100 | #325 | Tragic 22.5% |
| Paiute | 0.0 /100 | #326 | Tragic 22.8% |
| Immigrants | Honduras | 0.0 /100 | #327 | Tragic 22.8% |
| Pueblo | 0.0 /100 | #328 | Tragic 23.5% |
| Natives/Alaskans | 0.0 /100 | #329 | Tragic 24.0% |
| Colville | 0.0 /100 | #330 | Tragic 24.1% |
| Dominicans | 0.0 /100 | #331 | Tragic 24.2% |
| Immigrants | Dominican Republic | 0.0 /100 | #332 | Tragic 24.3% |
| Apache | 0.0 /100 | #333 | Tragic 24.5% |
| Blacks/African Americans | 0.0 /100 | #334 | Tragic 24.5% |
| Yup'ik | 0.0 /100 | #335 | Tragic 24.7% |
Demographics Similar to Estonians by Child Poverty Among Boys Under 16
In terms of child poverty among boys under 16, the demographic groups most similar to Estonians are Immigrants from Scotland (14.1%, a difference of 0.090%), Greek (14.1%, a difference of 0.20%), Croatian (14.0%, a difference of 0.21%), Immigrants from Moldova (14.1%, a difference of 0.47%), and Immigrants from Indonesia (14.1%, a difference of 0.49%).
| Demographics | Rating | Rank | Child Poverty Among Boys Under 16 |
| Immigrants | Sri Lanka | 99.6 /100 | #37 | Exceptional 13.9% |
| Immigrants | Northern Europe | 99.6 /100 | #38 | Exceptional 13.9% |
| Immigrants | Australia | 99.6 /100 | #39 | Exceptional 13.9% |
| Immigrants | Asia | 99.6 /100 | #40 | Exceptional 13.9% |
| Lithuanians | 99.6 /100 | #41 | Exceptional 14.0% |
| Koreans | 99.6 /100 | #42 | Exceptional 14.0% |
| Croatians | 99.5 /100 | #43 | Exceptional 14.0% |
| Estonians | 99.4 /100 | #44 | Exceptional 14.1% |
| Immigrants | Scotland | 99.4 /100 | #45 | Exceptional 14.1% |
| Greeks | 99.4 /100 | #46 | Exceptional 14.1% |
| Immigrants | Moldova | 99.4 /100 | #47 | Exceptional 14.1% |
| Immigrants | Indonesia | 99.4 /100 | #48 | Exceptional 14.1% |
| Czechs | 99.3 /100 | #49 | Exceptional 14.1% |
| Italians | 99.2 /100 | #50 | Exceptional 14.2% |
| Immigrants | Greece | 99.2 /100 | #51 | Exceptional 14.2% |