Ghanaian vs Taiwanese Child Poverty Among Boys Under 16
COMPARE
Ghanaian
Taiwanese
Child Poverty Among Boys Under 16
Child Poverty Among Boys Under 16 Comparison
Ghanaians
Taiwanese
18.9%
CHILD POVERTY AMONG BOYS UNDER 16
0.5/ 100
METRIC RATING
242nd/ 347
METRIC RANK
14.8%
CHILD POVERTY AMONG BOYS UNDER 16
97.3/ 100
METRIC RATING
85th/ 347
METRIC RANK
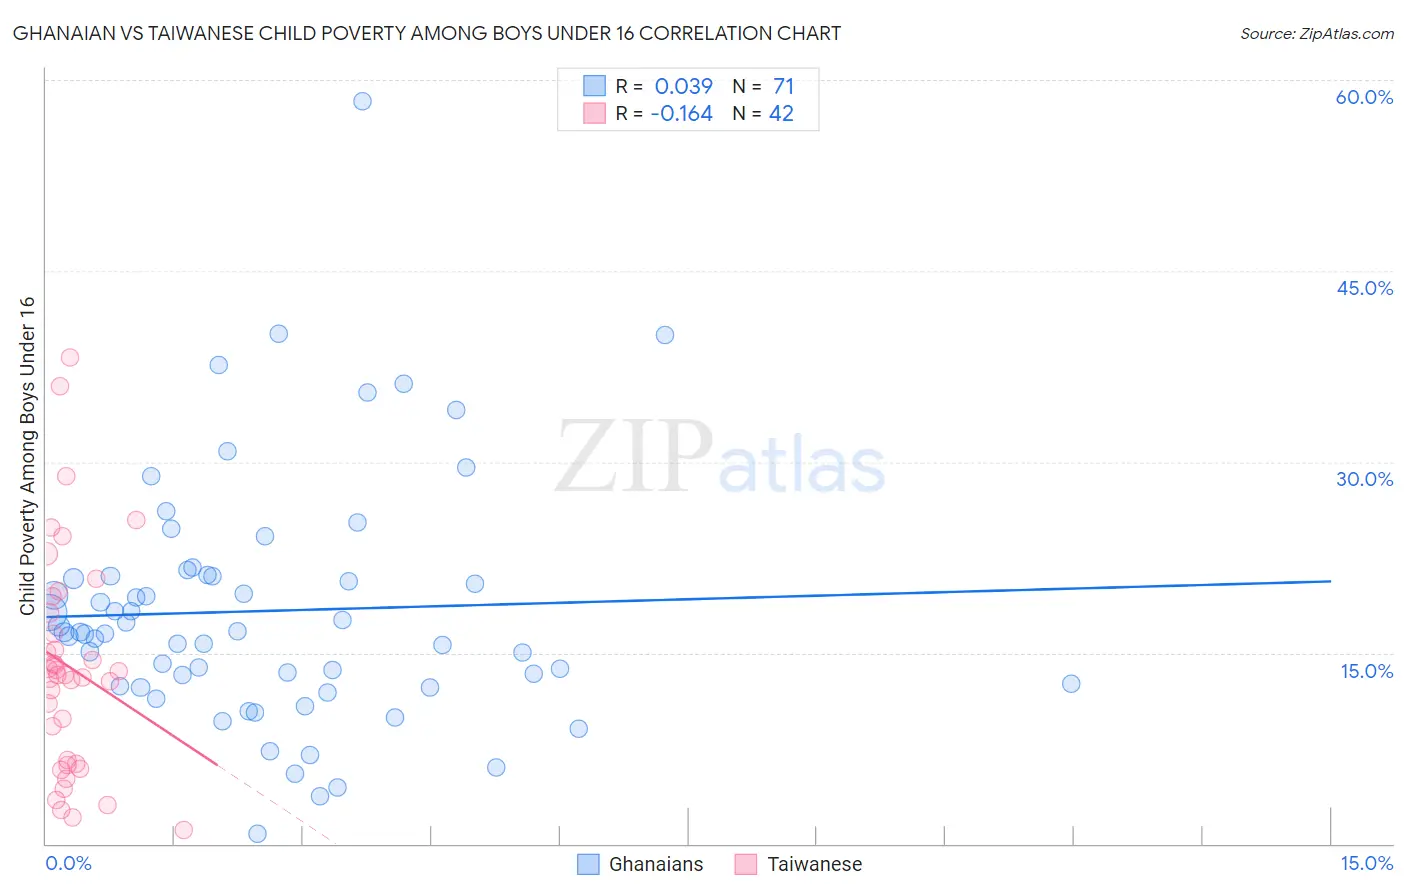
Ghanaian vs Taiwanese Child Poverty Among Boys Under 16 Correlation Chart
The statistical analysis conducted on geographies consisting of 189,368,520 people shows no correlation between the proportion of Ghanaians and poverty level among boys under the age of 16 in the United States with a correlation coefficient (R) of 0.039 and weighted average of 18.9%. Similarly, the statistical analysis conducted on geographies consisting of 31,649,664 people shows a poor negative correlation between the proportion of Taiwanese and poverty level among boys under the age of 16 in the United States with a correlation coefficient (R) of -0.164 and weighted average of 14.8%, a difference of 27.6%.
Child Poverty Among Boys Under 16 Correlation Summary
| Measurement | Ghanaian | Taiwanese |
| Minimum | 0.79% | 1.1% |
| Maximum | 58.3% | 38.2% |
| Range | 57.5% | 37.2% |
| Mean | 18.3% | 13.8% |
| Median | 16.6% | 13.2% |
| Interquartile 25% (IQ1) | 12.4% | 6.3% |
| Interquartile 75% (IQ3) | 21.0% | 18.1% |
| Interquartile Range (IQR) | 8.6% | 11.8% |
| Standard Deviation (Sample) | 9.7% | 8.7% |
| Standard Deviation (Population) | 9.6% | 8.5% |
Similar Demographics by Child Poverty Among Boys Under 16
Demographics Similar to Ghanaians by Child Poverty Among Boys Under 16
In terms of child poverty among boys under 16, the demographic groups most similar to Ghanaians are Immigrants from the Azores (18.9%, a difference of 0.34%), Immigrants from Middle Africa (18.9%, a difference of 0.35%), Cree (19.0%, a difference of 0.48%), Immigrants from Sudan (18.8%, a difference of 0.50%), and Immigrants from Cuba (18.8%, a difference of 0.56%).
| Demographics | Rating | Rank | Child Poverty Among Boys Under 16 |
| Americans | 0.9 /100 | #235 | Tragic 18.6% |
| Sudanese | 0.9 /100 | #236 | Tragic 18.6% |
| Immigrants | Eritrea | 0.8 /100 | #237 | Tragic 18.6% |
| Immigrants | Laos | 0.8 /100 | #238 | Tragic 18.7% |
| Cape Verdeans | 0.7 /100 | #239 | Tragic 18.7% |
| Immigrants | Cuba | 0.6 /100 | #240 | Tragic 18.8% |
| Immigrants | Sudan | 0.6 /100 | #241 | Tragic 18.8% |
| Ghanaians | 0.5 /100 | #242 | Tragic 18.9% |
| Immigrants | Azores | 0.4 /100 | #243 | Tragic 18.9% |
| Immigrants | Middle Africa | 0.4 /100 | #244 | Tragic 18.9% |
| Cree | 0.4 /100 | #245 | Tragic 19.0% |
| Immigrants | Nicaragua | 0.4 /100 | #246 | Tragic 19.0% |
| Immigrants | Trinidad and Tobago | 0.3 /100 | #247 | Tragic 19.0% |
| Salvadorans | 0.3 /100 | #248 | Tragic 19.0% |
| Alsatians | 0.3 /100 | #249 | Tragic 19.1% |
Demographics Similar to Taiwanese by Child Poverty Among Boys Under 16
In terms of child poverty among boys under 16, the demographic groups most similar to Taiwanese are Swiss (14.8%, a difference of 0.040%), German (14.8%, a difference of 0.070%), Northern European (14.8%, a difference of 0.12%), Immigrants from North America (14.8%, a difference of 0.13%), and Immigrants from South Africa (14.8%, a difference of 0.16%).
| Demographics | Rating | Rank | Child Poverty Among Boys Under 16 |
| Egyptians | 97.8 /100 | #78 | Exceptional 14.7% |
| Immigrants | Eastern Europe | 97.8 /100 | #79 | Exceptional 14.7% |
| Immigrants | Russia | 97.7 /100 | #80 | Exceptional 14.7% |
| Immigrants | Canada | 97.6 /100 | #81 | Exceptional 14.7% |
| Ukrainians | 97.6 /100 | #82 | Exceptional 14.7% |
| Immigrants | South Africa | 97.4 /100 | #83 | Exceptional 14.8% |
| Swiss | 97.3 /100 | #84 | Exceptional 14.8% |
| Taiwanese | 97.3 /100 | #85 | Exceptional 14.8% |
| Germans | 97.2 /100 | #86 | Exceptional 14.8% |
| Northern Europeans | 97.2 /100 | #87 | Exceptional 14.8% |
| Immigrants | North America | 97.1 /100 | #88 | Exceptional 14.8% |
| Immigrants | Argentina | 97.1 /100 | #89 | Exceptional 14.8% |
| Austrians | 97.1 /100 | #90 | Exceptional 14.8% |
| Paraguayans | 96.8 /100 | #91 | Exceptional 14.9% |
| Argentineans | 96.7 /100 | #92 | Exceptional 14.9% |