Ghanaian vs Choctaw Female Poverty Among 25-34 Year Olds
COMPARE
Ghanaian
Choctaw
Female Poverty Among 25-34 Year Olds
Female Poverty Among 25-34 Year Olds Comparison
Ghanaians
Choctaw
14.4%
FEMALE POVERTY AMONG 25-34 YEAR OLDS
4.8/ 100
METRIC RATING
220th/ 347
METRIC RANK
18.1%
FEMALE POVERTY AMONG 25-34 YEAR OLDS
0.0/ 100
METRIC RATING
321st/ 347
METRIC RANK
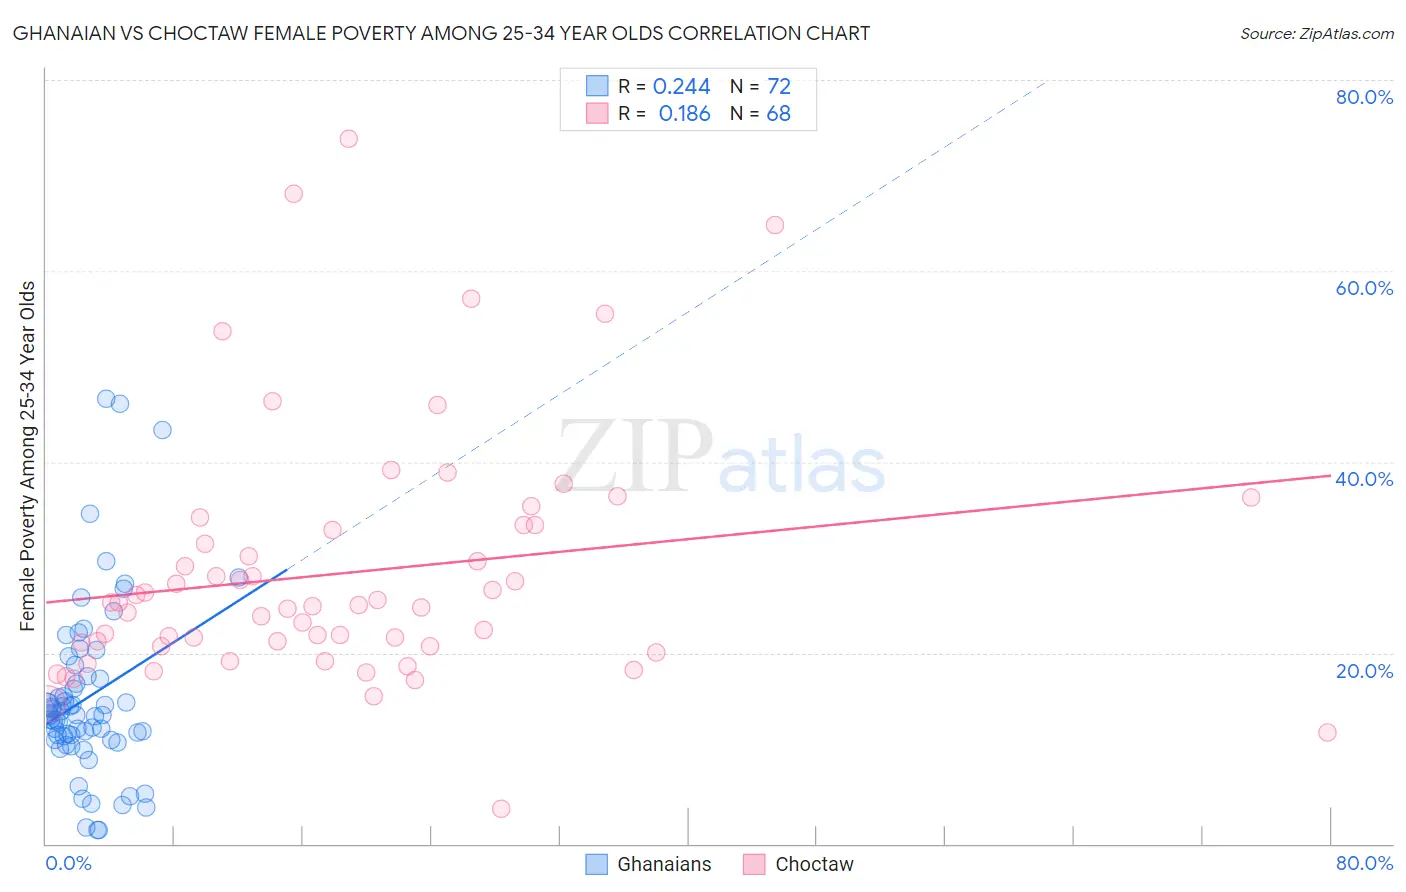
Ghanaian vs Choctaw Female Poverty Among 25-34 Year Olds Correlation Chart
The statistical analysis conducted on geographies consisting of 189,437,632 people shows a weak positive correlation between the proportion of Ghanaians and poverty level among females between the ages 25 and 34 in the United States with a correlation coefficient (R) of 0.244 and weighted average of 14.4%. Similarly, the statistical analysis conducted on geographies consisting of 267,245,536 people shows a poor positive correlation between the proportion of Choctaw and poverty level among females between the ages 25 and 34 in the United States with a correlation coefficient (R) of 0.186 and weighted average of 18.1%, a difference of 25.6%.
Female Poverty Among 25-34 Year Olds Correlation Summary
| Measurement | Ghanaian | Choctaw |
| Minimum | 1.4% | 3.6% |
| Maximum | 46.7% | 73.9% |
| Range | 45.2% | 70.3% |
| Mean | 15.3% | 28.4% |
| Median | 13.5% | 24.9% |
| Interquartile 25% (IQ1) | 11.1% | 20.7% |
| Interquartile 75% (IQ3) | 17.4% | 33.1% |
| Interquartile Range (IQR) | 6.3% | 12.4% |
| Standard Deviation (Sample) | 9.1% | 13.2% |
| Standard Deviation (Population) | 9.1% | 13.1% |
Similar Demographics by Female Poverty Among 25-34 Year Olds
Demographics Similar to Ghanaians by Female Poverty Among 25-34 Year Olds
In terms of female poverty among 25-34 year olds, the demographic groups most similar to Ghanaians are Sudanese (14.4%, a difference of 0.15%), Ecuadorian (14.3%, a difference of 0.16%), Immigrants from Thailand (14.3%, a difference of 0.17%), Immigrants from Portugal (14.4%, a difference of 0.22%), and French Canadian (14.3%, a difference of 0.28%).
| Demographics | Rating | Rank | Female Poverty Among 25-34 Year Olds |
| Puget Sound Salish | 6.5 /100 | #213 | Tragic 14.3% |
| French | 6.2 /100 | #214 | Tragic 14.3% |
| Immigrants | Nigeria | 6.2 /100 | #215 | Tragic 14.3% |
| French Canadians | 5.5 /100 | #216 | Tragic 14.3% |
| Spanish American Indians | 5.5 /100 | #217 | Tragic 14.3% |
| Immigrants | Thailand | 5.2 /100 | #218 | Tragic 14.3% |
| Ecuadorians | 5.2 /100 | #219 | Tragic 14.3% |
| Ghanaians | 4.8 /100 | #220 | Tragic 14.4% |
| Sudanese | 4.4 /100 | #221 | Tragic 14.4% |
| Immigrants | Portugal | 4.3 /100 | #222 | Tragic 14.4% |
| Nigerians | 4.2 /100 | #223 | Tragic 14.4% |
| Immigrants | Sudan | 4.0 /100 | #224 | Tragic 14.4% |
| Immigrants | Barbados | 3.4 /100 | #225 | Tragic 14.5% |
| Nicaraguans | 3.3 /100 | #226 | Tragic 14.5% |
| Celtics | 2.8 /100 | #227 | Tragic 14.5% |
Demographics Similar to Choctaw by Female Poverty Among 25-34 Year Olds
In terms of female poverty among 25-34 year olds, the demographic groups most similar to Choctaw are Chippewa (18.0%, a difference of 0.22%), Menominee (18.0%, a difference of 0.47%), Central American Indian (18.2%, a difference of 0.84%), Ute (17.9%, a difference of 1.0%), and Seminole (18.3%, a difference of 1.2%).
| Demographics | Rating | Rank | Female Poverty Among 25-34 Year Olds |
| Immigrants | Dominican Republic | 0.0 /100 | #314 | Tragic 17.6% |
| Yakama | 0.0 /100 | #315 | Tragic 17.6% |
| Dominicans | 0.0 /100 | #316 | Tragic 17.6% |
| Arapaho | 0.0 /100 | #317 | Tragic 17.8% |
| Ute | 0.0 /100 | #318 | Tragic 17.9% |
| Menominee | 0.0 /100 | #319 | Tragic 18.0% |
| Chippewa | 0.0 /100 | #320 | Tragic 18.0% |
| Choctaw | 0.0 /100 | #321 | Tragic 18.1% |
| Central American Indians | 0.0 /100 | #322 | Tragic 18.2% |
| Seminole | 0.0 /100 | #323 | Tragic 18.3% |
| Dutch West Indians | 0.0 /100 | #324 | Tragic 18.4% |
| Inupiat | 0.0 /100 | #325 | Tragic 18.5% |
| Blacks/African Americans | 0.0 /100 | #326 | Tragic 18.9% |
| Cheyenne | 0.0 /100 | #327 | Tragic 19.1% |
| Alaskan Athabascans | 0.0 /100 | #328 | Tragic 19.1% |