Ghanaian vs Egyptian Female Poverty Among 25-34 Year Olds
COMPARE
Ghanaian
Egyptian
Female Poverty Among 25-34 Year Olds
Female Poverty Among 25-34 Year Olds Comparison
Ghanaians
Egyptians
14.4%
FEMALE POVERTY AMONG 25-34 YEAR OLDS
4.8/ 100
METRIC RATING
220th/ 347
METRIC RANK
11.9%
FEMALE POVERTY AMONG 25-34 YEAR OLDS
99.7/ 100
METRIC RATING
43rd/ 347
METRIC RANK
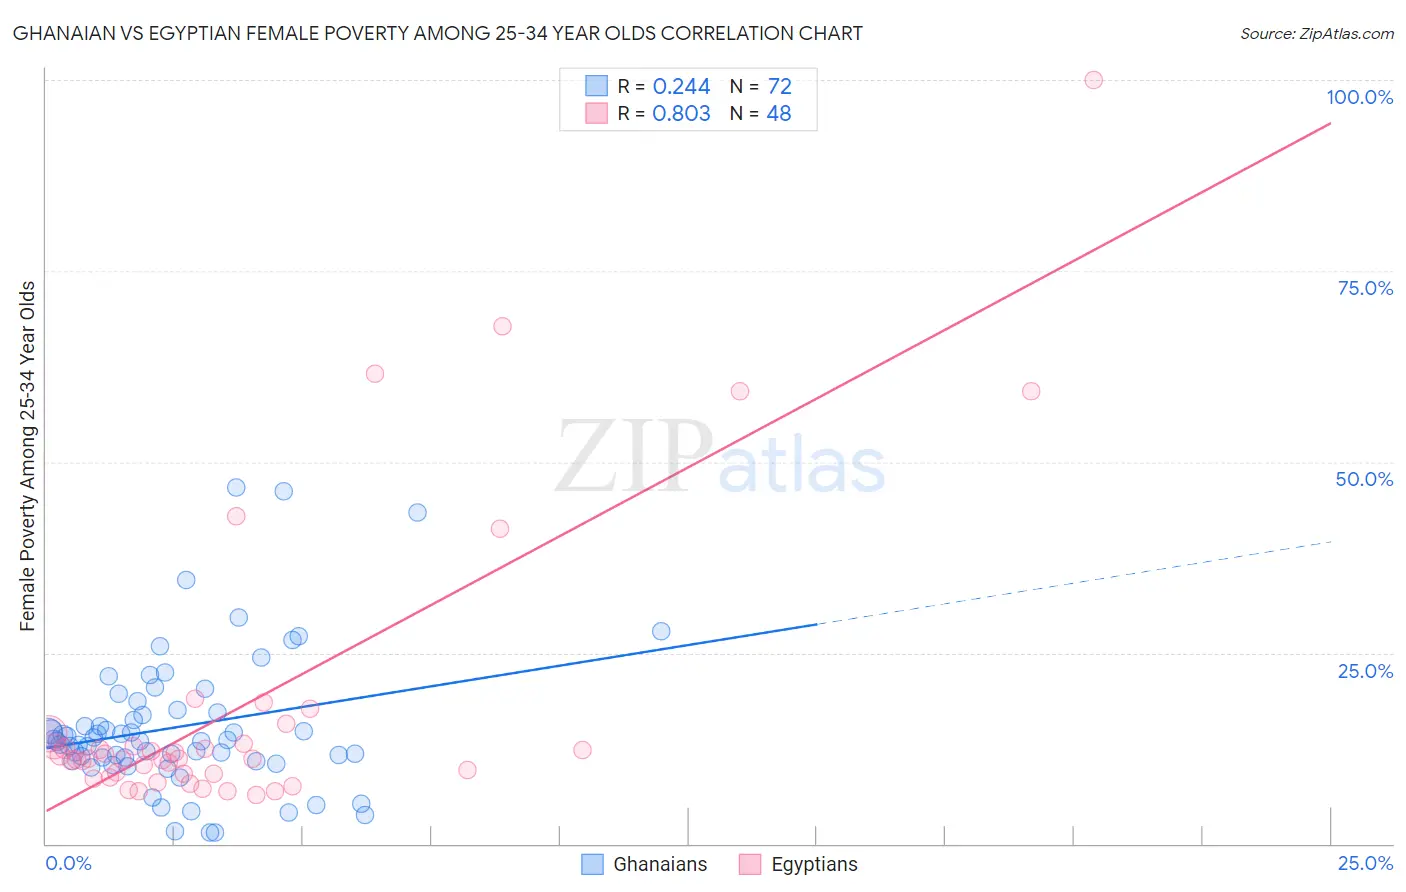
Ghanaian vs Egyptian Female Poverty Among 25-34 Year Olds Correlation Chart
The statistical analysis conducted on geographies consisting of 189,437,632 people shows a weak positive correlation between the proportion of Ghanaians and poverty level among females between the ages 25 and 34 in the United States with a correlation coefficient (R) of 0.244 and weighted average of 14.4%. Similarly, the statistical analysis conducted on geographies consisting of 273,751,830 people shows a very strong positive correlation between the proportion of Egyptians and poverty level among females between the ages 25 and 34 in the United States with a correlation coefficient (R) of 0.803 and weighted average of 11.9%, a difference of 20.7%.
Female Poverty Among 25-34 Year Olds Correlation Summary
| Measurement | Ghanaian | Egyptian |
| Minimum | 1.4% | 6.4% |
| Maximum | 46.7% | 100.0% |
| Range | 45.2% | 93.6% |
| Mean | 15.3% | 18.4% |
| Median | 13.5% | 11.1% |
| Interquartile 25% (IQ1) | 11.1% | 9.1% |
| Interquartile 75% (IQ3) | 17.4% | 13.7% |
| Interquartile Range (IQR) | 6.3% | 4.6% |
| Standard Deviation (Sample) | 9.1% | 19.6% |
| Standard Deviation (Population) | 9.1% | 19.4% |
Similar Demographics by Female Poverty Among 25-34 Year Olds
Demographics Similar to Ghanaians by Female Poverty Among 25-34 Year Olds
In terms of female poverty among 25-34 year olds, the demographic groups most similar to Ghanaians are Sudanese (14.4%, a difference of 0.15%), Ecuadorian (14.3%, a difference of 0.16%), Immigrants from Thailand (14.3%, a difference of 0.17%), Immigrants from Portugal (14.4%, a difference of 0.22%), and French Canadian (14.3%, a difference of 0.28%).
| Demographics | Rating | Rank | Female Poverty Among 25-34 Year Olds |
| Puget Sound Salish | 6.5 /100 | #213 | Tragic 14.3% |
| French | 6.2 /100 | #214 | Tragic 14.3% |
| Immigrants | Nigeria | 6.2 /100 | #215 | Tragic 14.3% |
| French Canadians | 5.5 /100 | #216 | Tragic 14.3% |
| Spanish American Indians | 5.5 /100 | #217 | Tragic 14.3% |
| Immigrants | Thailand | 5.2 /100 | #218 | Tragic 14.3% |
| Ecuadorians | 5.2 /100 | #219 | Tragic 14.3% |
| Ghanaians | 4.8 /100 | #220 | Tragic 14.4% |
| Sudanese | 4.4 /100 | #221 | Tragic 14.4% |
| Immigrants | Portugal | 4.3 /100 | #222 | Tragic 14.4% |
| Nigerians | 4.2 /100 | #223 | Tragic 14.4% |
| Immigrants | Sudan | 4.0 /100 | #224 | Tragic 14.4% |
| Immigrants | Barbados | 3.4 /100 | #225 | Tragic 14.5% |
| Nicaraguans | 3.3 /100 | #226 | Tragic 14.5% |
| Celtics | 2.8 /100 | #227 | Tragic 14.5% |
Demographics Similar to Egyptians by Female Poverty Among 25-34 Year Olds
In terms of female poverty among 25-34 year olds, the demographic groups most similar to Egyptians are Immigrants from Australia (11.9%, a difference of 0.010%), Immigrants from Turkey (11.9%, a difference of 0.25%), Macedonian (11.9%, a difference of 0.28%), Immigrants from Serbia (11.9%, a difference of 0.29%), and Korean (12.0%, a difference of 0.45%).
| Demographics | Rating | Rank | Female Poverty Among 25-34 Year Olds |
| Immigrants | Sri Lanka | 99.8 /100 | #36 | Exceptional 11.8% |
| Taiwanese | 99.8 /100 | #37 | Exceptional 11.8% |
| Immigrants | North Macedonia | 99.8 /100 | #38 | Exceptional 11.8% |
| Latvians | 99.8 /100 | #39 | Exceptional 11.8% |
| Immigrants | Bulgaria | 99.8 /100 | #40 | Exceptional 11.8% |
| Immigrants | Indonesia | 99.8 /100 | #41 | Exceptional 11.8% |
| Immigrants | Turkey | 99.7 /100 | #42 | Exceptional 11.9% |
| Egyptians | 99.7 /100 | #43 | Exceptional 11.9% |
| Immigrants | Australia | 99.7 /100 | #44 | Exceptional 11.9% |
| Macedonians | 99.7 /100 | #45 | Exceptional 11.9% |
| Immigrants | Serbia | 99.7 /100 | #46 | Exceptional 11.9% |
| Koreans | 99.6 /100 | #47 | Exceptional 12.0% |
| Immigrants | Belarus | 99.6 /100 | #48 | Exceptional 12.0% |
| Immigrants | Egypt | 99.6 /100 | #49 | Exceptional 12.0% |
| Immigrants | Croatia | 99.6 /100 | #50 | Exceptional 12.0% |