Immigrants from Kenya vs Nigerian Single Female Poverty
COMPARE
Immigrants from Kenya
Nigerian
Single Female Poverty
Single Female Poverty Comparison
Immigrants from Kenya
Nigerians
21.4%
SINGLE FEMALE POVERTY
20.7/ 100
METRIC RATING
202nd/ 347
METRIC RANK
21.4%
SINGLE FEMALE POVERTY
20.9/ 100
METRIC RATING
201st/ 347
METRIC RANK
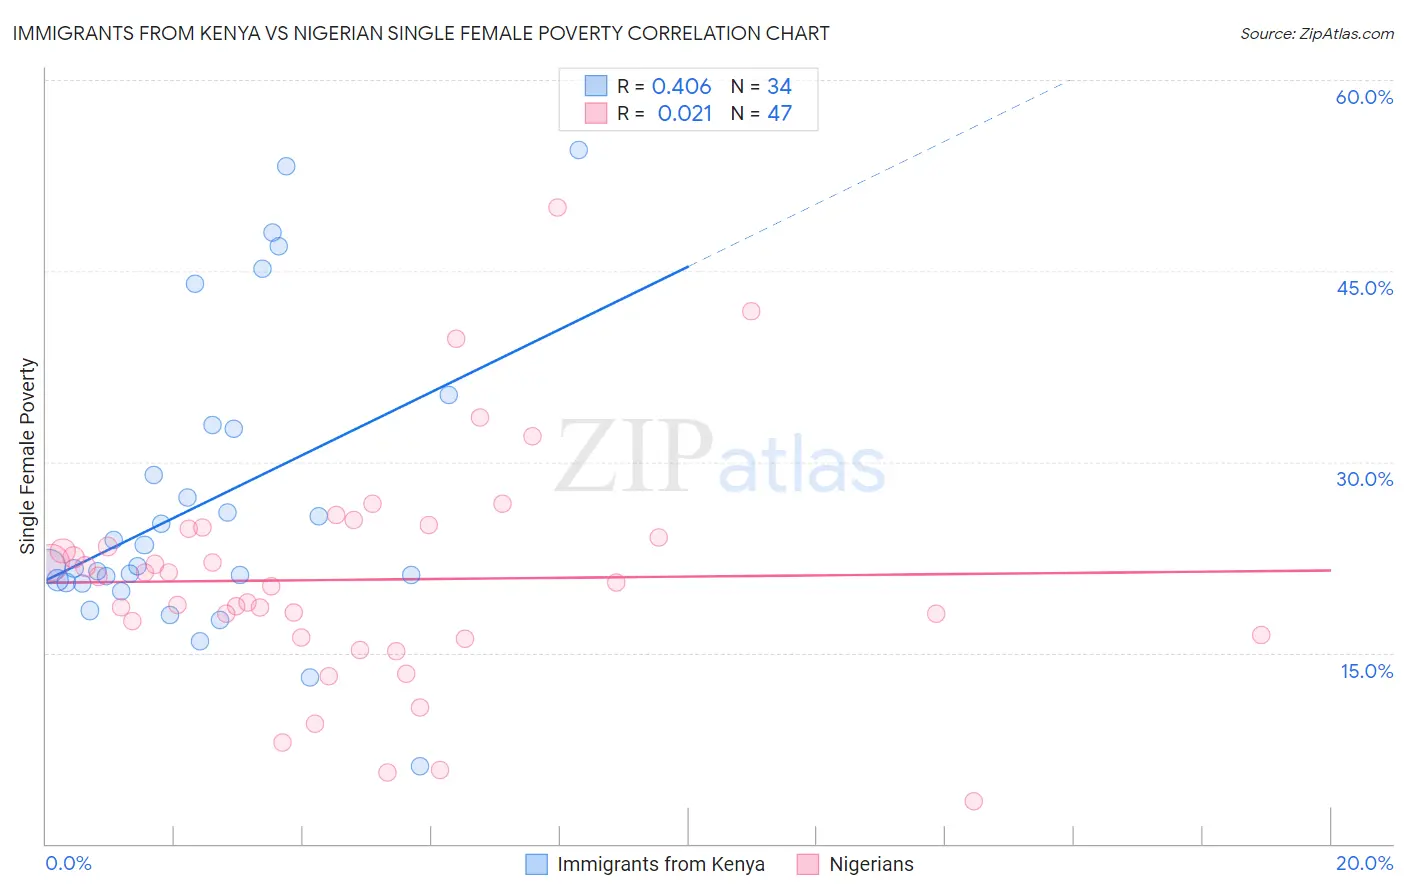
Immigrants from Kenya vs Nigerian Single Female Poverty Correlation Chart
The statistical analysis conducted on geographies consisting of 216,607,020 people shows a moderate positive correlation between the proportion of Immigrants from Kenya and poverty level among single females in the United States with a correlation coefficient (R) of 0.406 and weighted average of 21.4%. Similarly, the statistical analysis conducted on geographies consisting of 330,209,143 people shows no correlation between the proportion of Nigerians and poverty level among single females in the United States with a correlation coefficient (R) of 0.021 and weighted average of 21.4%, a difference of 0.020%.
Single Female Poverty Correlation Summary
| Measurement | Immigrants from Kenya | Nigerian |
| Minimum | 6.1% | 3.3% |
| Maximum | 54.5% | 50.0% |
| Range | 48.4% | 46.7% |
| Mean | 26.9% | 20.7% |
| Median | 21.8% | 20.5% |
| Interquartile 25% (IQ1) | 20.5% | 16.2% |
| Interquartile 75% (IQ3) | 32.6% | 24.8% |
| Interquartile Range (IQR) | 12.0% | 8.6% |
| Standard Deviation (Sample) | 11.7% | 8.8% |
| Standard Deviation (Population) | 11.5% | 8.7% |
Demographics Similar to Immigrants from Kenya and Nigerians by Single Female Poverty
In terms of single female poverty, the demographic groups most similar to Immigrants from Kenya are Irish (21.4%, a difference of 0.070%), Immigrants (21.4%, a difference of 0.12%), Immigrants from Haiti (21.5%, a difference of 0.18%), Swiss (21.4%, a difference of 0.31%), and Immigrants from Africa (21.5%, a difference of 0.40%). Similarly, the demographic groups most similar to Nigerians are Irish (21.4%, a difference of 0.040%), Immigrants (21.4%, a difference of 0.10%), Immigrants from Haiti (21.5%, a difference of 0.20%), Swiss (21.4%, a difference of 0.29%), and Immigrants from Africa (21.5%, a difference of 0.42%).
| Demographics | Rating | Rank | Single Female Poverty |
| Immigrants | Germany | 31.1 /100 | #191 | Fair 21.3% |
| Immigrants | Jamaica | 30.5 /100 | #192 | Fair 21.3% |
| Basques | 28.1 /100 | #193 | Fair 21.3% |
| Czechoslovakians | 27.7 /100 | #194 | Fair 21.3% |
| Nicaraguans | 27.6 /100 | #195 | Fair 21.3% |
| Immigrants | Saudi Arabia | 27.1 /100 | #196 | Fair 21.3% |
| Japanese | 26.4 /100 | #197 | Fair 21.3% |
| Swiss | 24.2 /100 | #198 | Fair 21.4% |
| Immigrants | Immigrants | 22.0 /100 | #199 | Fair 21.4% |
| Irish | 21.4 /100 | #200 | Fair 21.4% |
| Nigerians | 20.9 /100 | #201 | Fair 21.4% |
| Immigrants | Kenya | 20.7 /100 | #202 | Fair 21.4% |
| Immigrants | Haiti | 18.8 /100 | #203 | Poor 21.5% |
| Immigrants | Africa | 16.7 /100 | #204 | Poor 21.5% |
| Finns | 16.2 /100 | #205 | Poor 21.5% |
| Belgians | 16.1 /100 | #206 | Poor 21.5% |
| Ghanaians | 15.7 /100 | #207 | Poor 21.6% |
| Haitians | 15.4 /100 | #208 | Poor 21.6% |
| Immigrants | Eastern Africa | 15.1 /100 | #209 | Poor 21.6% |
| Immigrants | Panama | 14.4 /100 | #210 | Poor 21.6% |
| Icelanders | 14.0 /100 | #211 | Poor 21.6% |