German vs Immigrants Single Male Poverty
COMPARE
German
Immigrants
Single Male Poverty
Single Male Poverty Comparison
Germans
Immigrants
13.9%
SINGLE MALE POVERTY
0.1/ 100
METRIC RATING
267th/ 347
METRIC RANK
12.7%
SINGLE MALE POVERTY
70.1/ 100
METRIC RATING
153rd/ 347
METRIC RANK
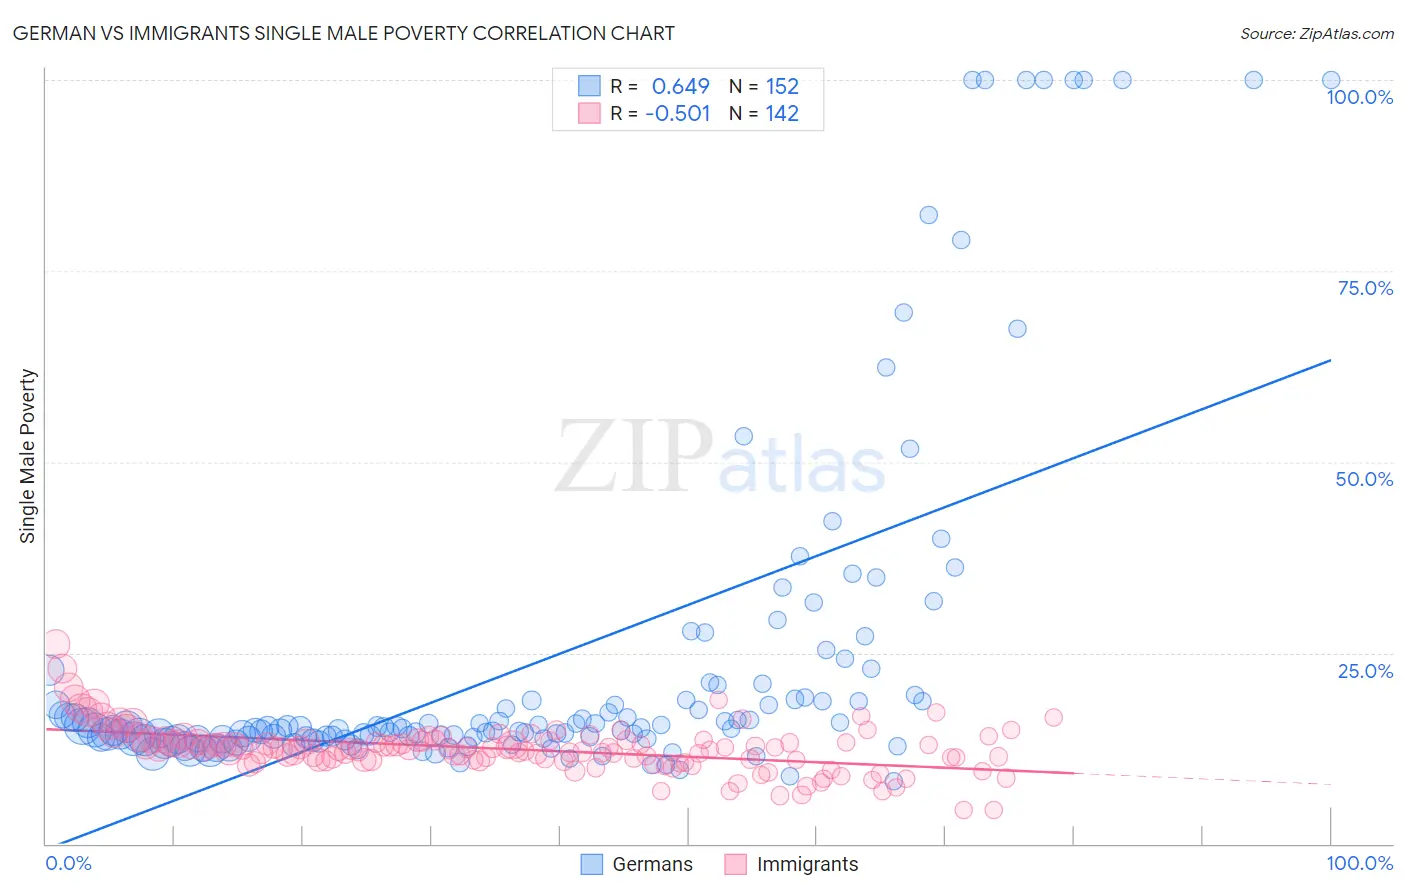
German vs Immigrants Single Male Poverty Correlation Chart
The statistical analysis conducted on geographies consisting of 476,219,018 people shows a significant positive correlation between the proportion of Germans and poverty level among single males in the United States with a correlation coefficient (R) of 0.649 and weighted average of 13.9%. Similarly, the statistical analysis conducted on geographies consisting of 470,345,123 people shows a substantial negative correlation between the proportion of Immigrants and poverty level among single males in the United States with a correlation coefficient (R) of -0.501 and weighted average of 12.7%, a difference of 10.1%.
Single Male Poverty Correlation Summary
| Measurement | German | Immigrants |
| Minimum | 8.2% | 4.4% |
| Maximum | 100.0% | 26.2% |
| Range | 91.8% | 21.8% |
| Mean | 23.9% | 12.4% |
| Median | 15.1% | 12.5% |
| Interquartile 25% (IQ1) | 13.8% | 11.0% |
| Interquartile 75% (IQ3) | 19.0% | 13.5% |
| Interquartile Range (IQR) | 5.3% | 2.5% |
| Standard Deviation (Sample) | 22.7% | 3.1% |
| Standard Deviation (Population) | 22.7% | 3.1% |
Similar Demographics by Single Male Poverty
Demographics Similar to Germans by Single Male Poverty
In terms of single male poverty, the demographic groups most similar to Germans are Immigrants from Mexico (13.9%, a difference of 0.070%), Immigrants from Cabo Verde (13.9%, a difference of 0.16%), Scottish (14.0%, a difference of 0.22%), Immigrants from Saudi Arabia (14.0%, a difference of 0.23%), and Irish (14.0%, a difference of 0.27%).
| Demographics | Rating | Rank | Single Male Poverty |
| Swiss | 0.3 /100 | #260 | Tragic 13.8% |
| Hungarians | 0.3 /100 | #261 | Tragic 13.8% |
| Fijians | 0.3 /100 | #262 | Tragic 13.8% |
| Cape Verdeans | 0.2 /100 | #263 | Tragic 13.8% |
| West Indians | 0.2 /100 | #264 | Tragic 13.8% |
| Immigrants | Congo | 0.2 /100 | #265 | Tragic 13.9% |
| Immigrants | Cabo Verde | 0.1 /100 | #266 | Tragic 13.9% |
| Germans | 0.1 /100 | #267 | Tragic 13.9% |
| Immigrants | Mexico | 0.1 /100 | #268 | Tragic 13.9% |
| Scottish | 0.1 /100 | #269 | Tragic 14.0% |
| Immigrants | Saudi Arabia | 0.1 /100 | #270 | Tragic 14.0% |
| Irish | 0.1 /100 | #271 | Tragic 14.0% |
| Mexicans | 0.1 /100 | #272 | Tragic 14.0% |
| Welsh | 0.1 /100 | #273 | Tragic 14.0% |
| Hondurans | 0.1 /100 | #274 | Tragic 14.0% |
Demographics Similar to Immigrants by Single Male Poverty
In terms of single male poverty, the demographic groups most similar to Immigrants are Immigrants from Scotland (12.7%, a difference of 0.070%), Australian (12.6%, a difference of 0.080%), Immigrants from Spain (12.7%, a difference of 0.090%), Immigrants from Hungary (12.6%, a difference of 0.12%), and Immigrants from Panama (12.6%, a difference of 0.13%).
| Demographics | Rating | Rank | Single Male Poverty |
| Native Hawaiians | 75.0 /100 | #146 | Good 12.6% |
| Malaysians | 74.8 /100 | #147 | Good 12.6% |
| Yugoslavians | 73.9 /100 | #148 | Good 12.6% |
| Sierra Leoneans | 73.0 /100 | #149 | Good 12.6% |
| Immigrants | Panama | 72.1 /100 | #150 | Good 12.6% |
| Immigrants | Hungary | 71.9 /100 | #151 | Good 12.6% |
| Australians | 71.4 /100 | #152 | Good 12.6% |
| Immigrants | Immigrants | 70.1 /100 | #153 | Good 12.7% |
| Immigrants | Scotland | 68.9 /100 | #154 | Good 12.7% |
| Immigrants | Spain | 68.7 /100 | #155 | Good 12.7% |
| Vietnamese | 67.9 /100 | #156 | Good 12.7% |
| Latvians | 67.9 /100 | #157 | Good 12.7% |
| Immigrants | Middle Africa | 64.9 /100 | #158 | Good 12.7% |
| Immigrants | Liberia | 64.2 /100 | #159 | Good 12.7% |
| Greeks | 64.1 /100 | #160 | Good 12.7% |