German vs Immigrants from India Single Male Poverty
COMPARE
German
Immigrants from India
Single Male Poverty
Single Male Poverty Comparison
Germans
Immigrants from India
13.9%
SINGLE MALE POVERTY
0.1/ 100
METRIC RATING
267th/ 347
METRIC RANK
10.3%
SINGLE MALE POVERTY
100.0/ 100
METRIC RATING
3rd/ 347
METRIC RANK
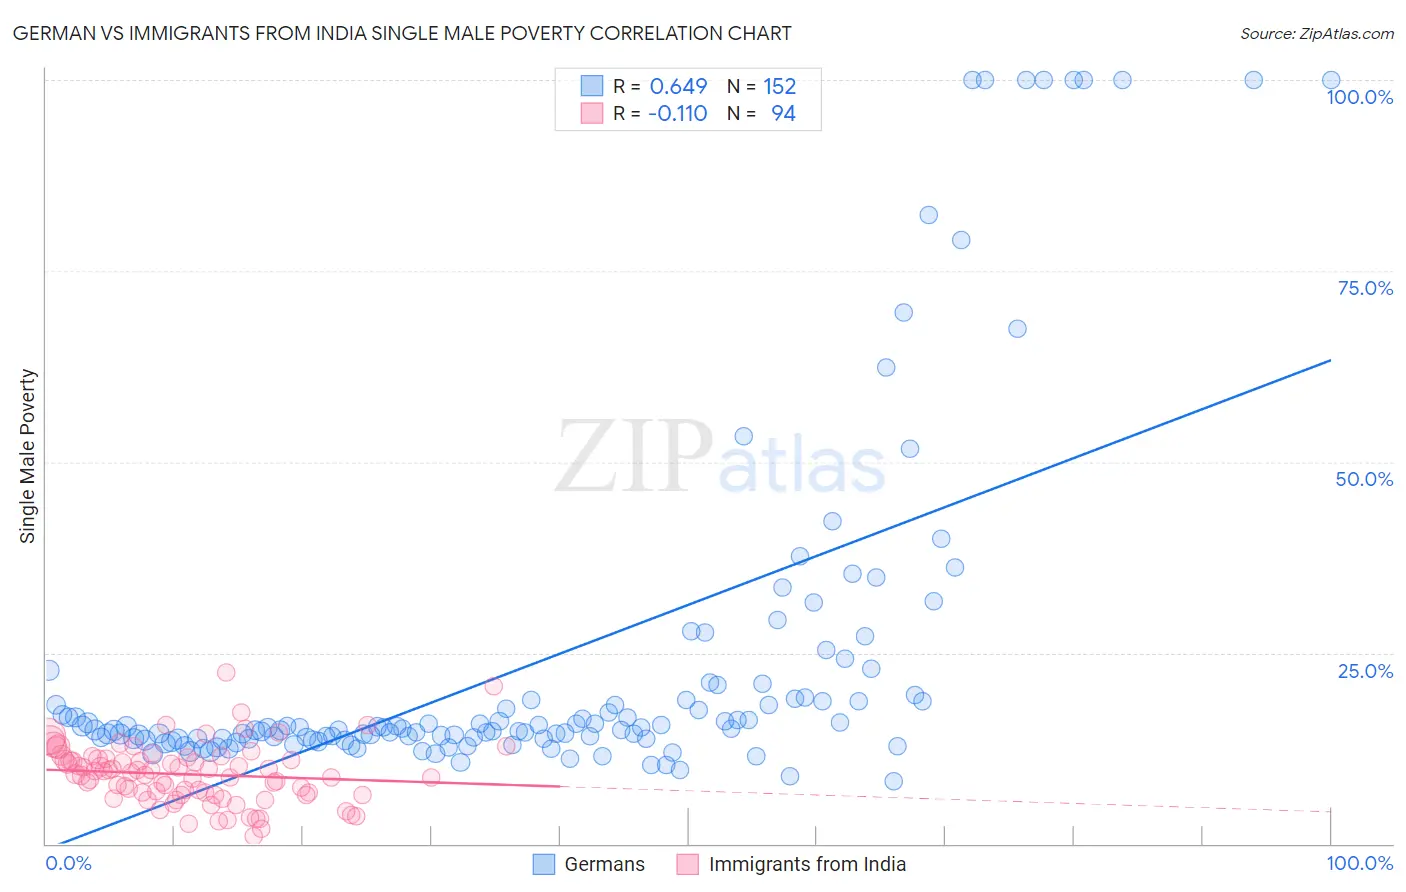
German vs Immigrants from India Single Male Poverty Correlation Chart
The statistical analysis conducted on geographies consisting of 476,219,018 people shows a significant positive correlation between the proportion of Germans and poverty level among single males in the United States with a correlation coefficient (R) of 0.649 and weighted average of 13.9%. Similarly, the statistical analysis conducted on geographies consisting of 378,048,247 people shows a poor negative correlation between the proportion of Immigrants from India and poverty level among single males in the United States with a correlation coefficient (R) of -0.110 and weighted average of 10.3%, a difference of 34.7%.
Single Male Poverty Correlation Summary
| Measurement | German | Immigrants from India |
| Minimum | 8.2% | 0.99% |
| Maximum | 100.0% | 22.5% |
| Range | 91.8% | 21.5% |
| Mean | 23.9% | 9.1% |
| Median | 15.1% | 9.2% |
| Interquartile 25% (IQ1) | 13.8% | 6.4% |
| Interquartile 75% (IQ3) | 19.0% | 11.1% |
| Interquartile Range (IQR) | 5.3% | 4.6% |
| Standard Deviation (Sample) | 22.7% | 3.9% |
| Standard Deviation (Population) | 22.7% | 3.8% |
Similar Demographics by Single Male Poverty
Demographics Similar to Germans by Single Male Poverty
In terms of single male poverty, the demographic groups most similar to Germans are Immigrants from Mexico (13.9%, a difference of 0.070%), Immigrants from Cabo Verde (13.9%, a difference of 0.16%), Scottish (14.0%, a difference of 0.22%), Immigrants from Saudi Arabia (14.0%, a difference of 0.23%), and Irish (14.0%, a difference of 0.27%).
| Demographics | Rating | Rank | Single Male Poverty |
| Swiss | 0.3 /100 | #260 | Tragic 13.8% |
| Hungarians | 0.3 /100 | #261 | Tragic 13.8% |
| Fijians | 0.3 /100 | #262 | Tragic 13.8% |
| Cape Verdeans | 0.2 /100 | #263 | Tragic 13.8% |
| West Indians | 0.2 /100 | #264 | Tragic 13.8% |
| Immigrants | Congo | 0.2 /100 | #265 | Tragic 13.9% |
| Immigrants | Cabo Verde | 0.1 /100 | #266 | Tragic 13.9% |
| Germans | 0.1 /100 | #267 | Tragic 13.9% |
| Immigrants | Mexico | 0.1 /100 | #268 | Tragic 13.9% |
| Scottish | 0.1 /100 | #269 | Tragic 14.0% |
| Immigrants | Saudi Arabia | 0.1 /100 | #270 | Tragic 14.0% |
| Irish | 0.1 /100 | #271 | Tragic 14.0% |
| Mexicans | 0.1 /100 | #272 | Tragic 14.0% |
| Welsh | 0.1 /100 | #273 | Tragic 14.0% |
| Hondurans | 0.1 /100 | #274 | Tragic 14.0% |
Demographics Similar to Immigrants from India by Single Male Poverty
In terms of single male poverty, the demographic groups most similar to Immigrants from India are Immigrants from Taiwan (10.3%, a difference of 0.67%), Immigrants from Hong Kong (10.4%, a difference of 0.97%), Tongan (10.5%, a difference of 1.0%), Filipino (10.6%, a difference of 2.7%), and Afghan (10.7%, a difference of 3.5%).
| Demographics | Rating | Rank | Single Male Poverty |
| Assyrians/Chaldeans/Syriacs | 100.0 /100 | #1 | Exceptional 9.8% |
| Immigrants | Taiwan | 100.0 /100 | #2 | Exceptional 10.3% |
| Immigrants | India | 100.0 /100 | #3 | Exceptional 10.3% |
| Immigrants | Hong Kong | 100.0 /100 | #4 | Exceptional 10.4% |
| Tongans | 100.0 /100 | #5 | Exceptional 10.5% |
| Filipinos | 100.0 /100 | #6 | Exceptional 10.6% |
| Afghans | 100.0 /100 | #7 | Exceptional 10.7% |
| Thais | 100.0 /100 | #8 | Exceptional 10.8% |
| Taiwanese | 100.0 /100 | #9 | Exceptional 10.9% |
| Immigrants | Fiji | 100.0 /100 | #10 | Exceptional 10.9% |
| Immigrants | Philippines | 100.0 /100 | #11 | Exceptional 10.9% |
| Immigrants | Afghanistan | 100.0 /100 | #12 | Exceptional 10.9% |
| Immigrants | South Central Asia | 100.0 /100 | #13 | Exceptional 10.9% |
| Chinese | 100.0 /100 | #14 | Exceptional 11.0% |
| Koreans | 100.0 /100 | #15 | Exceptional 11.0% |