French Canadian vs Pennsylvania German Female Poverty Among 18-24 Year Olds
COMPARE
French Canadian
Pennsylvania German
Female Poverty Among 18-24 Year Olds
Female Poverty Among 18-24 Year Olds Comparison
French Canadians
Pennsylvania Germans
19.9%
FEMALE POVERTY AMONG 18-24 YEAR OLDS
73.0/ 100
METRIC RATING
162nd/ 347
METRIC RANK
19.7%
FEMALE POVERTY AMONG 18-24 YEAR OLDS
85.5/ 100
METRIC RATING
141st/ 347
METRIC RANK
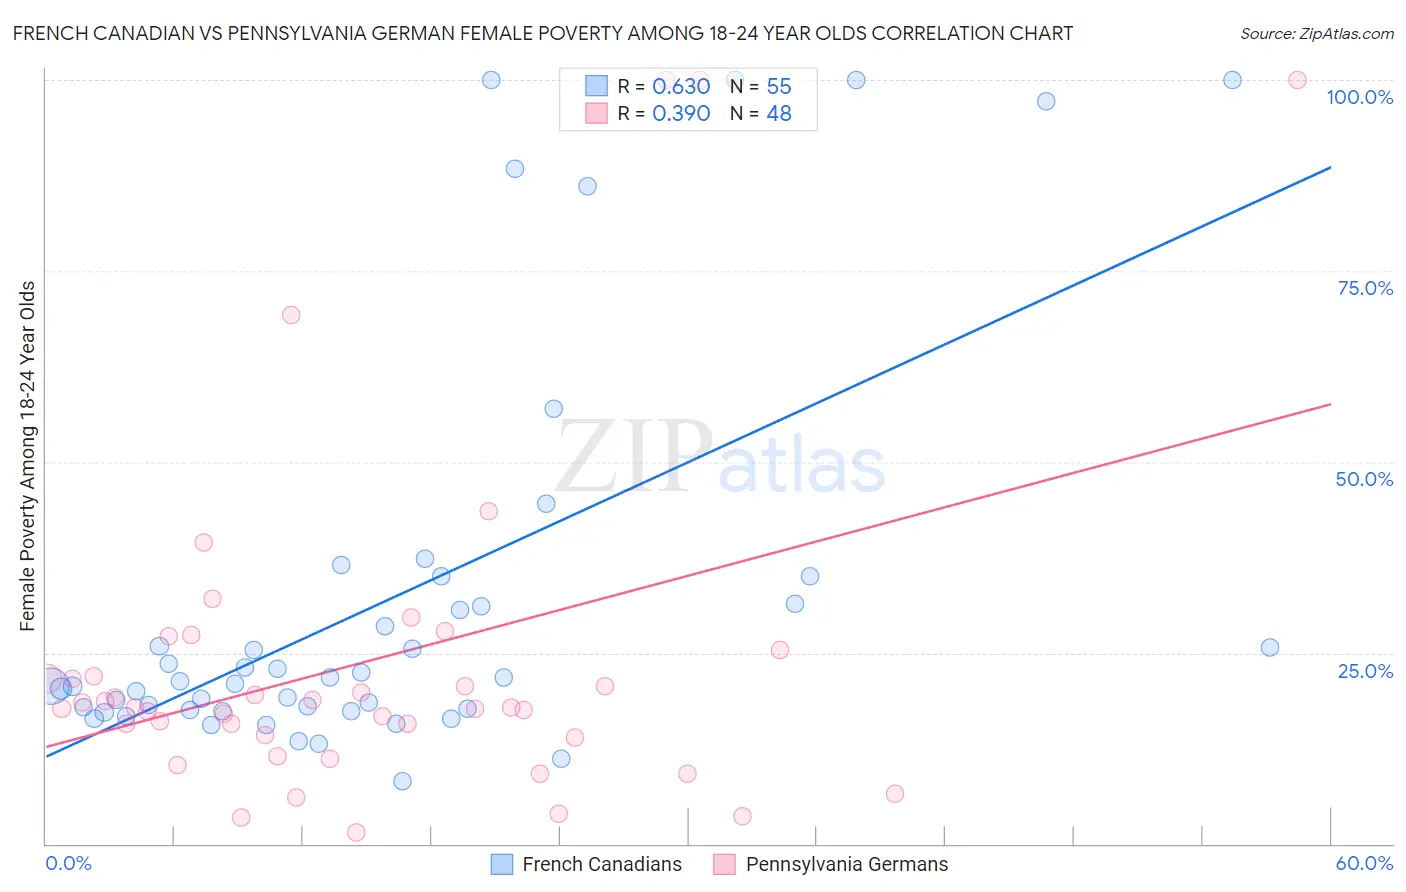
French Canadian vs Pennsylvania German Female Poverty Among 18-24 Year Olds Correlation Chart
The statistical analysis conducted on geographies consisting of 479,685,705 people shows a significant positive correlation between the proportion of French Canadians and poverty level among females between the ages 18 and 24 in the United States with a correlation coefficient (R) of 0.630 and weighted average of 19.9%. Similarly, the statistical analysis conducted on geographies consisting of 228,021,378 people shows a mild positive correlation between the proportion of Pennsylvania Germans and poverty level among females between the ages 18 and 24 in the United States with a correlation coefficient (R) of 0.390 and weighted average of 19.7%, a difference of 0.98%.
Female Poverty Among 18-24 Year Olds Correlation Summary
| Measurement | French Canadian | Pennsylvania German |
| Minimum | 8.2% | 1.4% |
| Maximum | 100.0% | 100.0% |
| Range | 91.8% | 98.6% |
| Mean | 32.0% | 23.9% |
| Median | 21.3% | 17.8% |
| Interquartile 25% (IQ1) | 17.5% | 14.0% |
| Interquartile 75% (IQ3) | 31.3% | 23.7% |
| Interquartile Range (IQR) | 13.9% | 9.6% |
| Standard Deviation (Sample) | 26.1% | 22.8% |
| Standard Deviation (Population) | 25.9% | 22.6% |
Similar Demographics by Female Poverty Among 18-24 Year Olds
Demographics Similar to French Canadians by Female Poverty Among 18-24 Year Olds
In terms of female poverty among 18-24 year olds, the demographic groups most similar to French Canadians are Malaysian (19.9%, a difference of 0.020%), Pakistani (19.8%, a difference of 0.070%), Immigrants from Belize (19.8%, a difference of 0.070%), Trinidadian and Tobagonian (19.8%, a difference of 0.090%), and Immigrants from Lebanon (19.8%, a difference of 0.15%).
| Demographics | Rating | Rank | Female Poverty Among 18-24 Year Olds |
| Hungarians | 76.6 /100 | #155 | Good 19.8% |
| Immigrants | Belgium | 76.4 /100 | #156 | Good 19.8% |
| Danes | 75.5 /100 | #157 | Good 19.8% |
| Immigrants | Lebanon | 75.3 /100 | #158 | Good 19.8% |
| Trinidadians and Tobagonians | 74.4 /100 | #159 | Good 19.8% |
| Pakistanis | 74.1 /100 | #160 | Good 19.8% |
| Immigrants | Belize | 74.1 /100 | #161 | Good 19.8% |
| French Canadians | 73.0 /100 | #162 | Good 19.9% |
| Malaysians | 72.7 /100 | #163 | Good 19.9% |
| Central Americans | 70.0 /100 | #164 | Good 19.9% |
| Eastern Europeans | 69.3 /100 | #165 | Good 19.9% |
| Belgians | 69.1 /100 | #166 | Good 19.9% |
| Czechoslovakians | 61.8 /100 | #167 | Good 20.0% |
| Fijians | 59.1 /100 | #168 | Average 20.0% |
| Hmong | 55.4 /100 | #169 | Average 20.0% |
Demographics Similar to Pennsylvania Germans by Female Poverty Among 18-24 Year Olds
In terms of female poverty among 18-24 year olds, the demographic groups most similar to Pennsylvania Germans are Immigrants from Trinidad and Tobago (19.7%, a difference of 0.010%), Panamanian (19.7%, a difference of 0.090%), Slavic (19.7%, a difference of 0.11%), Immigrants from Northern Africa (19.7%, a difference of 0.14%), and Canadian (19.7%, a difference of 0.17%).
| Demographics | Rating | Rank | Female Poverty Among 18-24 Year Olds |
| Immigrants | North America | 92.1 /100 | #134 | Exceptional 19.5% |
| Soviet Union | 92.0 /100 | #135 | Exceptional 19.5% |
| Russians | 91.5 /100 | #136 | Exceptional 19.5% |
| Austrians | 90.7 /100 | #137 | Exceptional 19.5% |
| Immigrants | Morocco | 89.9 /100 | #138 | Excellent 19.6% |
| Indians (Asian) | 88.3 /100 | #139 | Excellent 19.6% |
| Immigrants | Trinidad and Tobago | 85.6 /100 | #140 | Excellent 19.7% |
| Pennsylvania Germans | 85.5 /100 | #141 | Excellent 19.7% |
| Panamanians | 84.6 /100 | #142 | Excellent 19.7% |
| Slavs | 84.4 /100 | #143 | Excellent 19.7% |
| Immigrants | Northern Africa | 84.1 /100 | #144 | Excellent 19.7% |
| Canadians | 83.8 /100 | #145 | Excellent 19.7% |
| Immigrants | Bosnia and Herzegovina | 83.6 /100 | #146 | Excellent 19.7% |
| Immigrants | Austria | 83.1 /100 | #147 | Excellent 19.7% |
| Immigrants | Latin America | 81.3 /100 | #148 | Excellent 19.7% |