French Canadian vs Burmese Female Poverty Among 18-24 Year Olds
COMPARE
French Canadian
Burmese
Female Poverty Among 18-24 Year Olds
Female Poverty Among 18-24 Year Olds Comparison
French Canadians
Burmese
19.9%
FEMALE POVERTY AMONG 18-24 YEAR OLDS
73.0/ 100
METRIC RATING
162nd/ 347
METRIC RANK
18.9%
FEMALE POVERTY AMONG 18-24 YEAR OLDS
99.2/ 100
METRIC RATING
84th/ 347
METRIC RANK
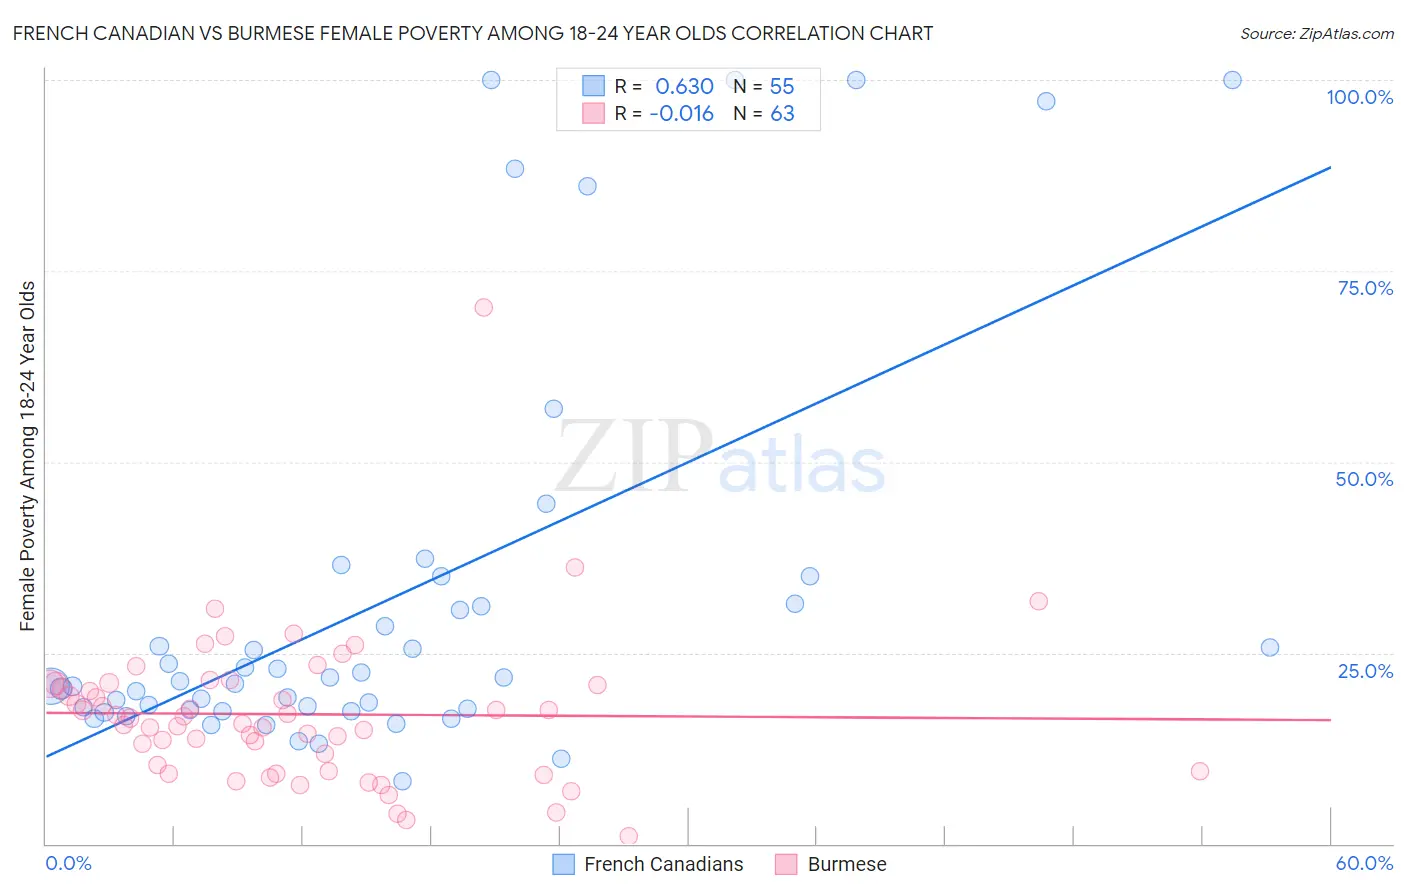
French Canadian vs Burmese Female Poverty Among 18-24 Year Olds Correlation Chart
The statistical analysis conducted on geographies consisting of 479,685,705 people shows a significant positive correlation between the proportion of French Canadians and poverty level among females between the ages 18 and 24 in the United States with a correlation coefficient (R) of 0.630 and weighted average of 19.9%. Similarly, the statistical analysis conducted on geographies consisting of 450,126,497 people shows no correlation between the proportion of Burmese and poverty level among females between the ages 18 and 24 in the United States with a correlation coefficient (R) of -0.016 and weighted average of 18.9%, a difference of 5.0%.
Female Poverty Among 18-24 Year Olds Correlation Summary
| Measurement | French Canadian | Burmese |
| Minimum | 8.2% | 0.99% |
| Maximum | 100.0% | 70.3% |
| Range | 91.8% | 69.3% |
| Mean | 32.0% | 16.9% |
| Median | 21.3% | 16.5% |
| Interquartile 25% (IQ1) | 17.5% | 9.5% |
| Interquartile 75% (IQ3) | 31.3% | 21.0% |
| Interquartile Range (IQR) | 13.9% | 11.5% |
| Standard Deviation (Sample) | 26.1% | 9.9% |
| Standard Deviation (Population) | 25.9% | 9.9% |
Similar Demographics by Female Poverty Among 18-24 Year Olds
Demographics Similar to French Canadians by Female Poverty Among 18-24 Year Olds
In terms of female poverty among 18-24 year olds, the demographic groups most similar to French Canadians are Malaysian (19.9%, a difference of 0.020%), Pakistani (19.8%, a difference of 0.070%), Immigrants from Belize (19.8%, a difference of 0.070%), Trinidadian and Tobagonian (19.8%, a difference of 0.090%), and Immigrants from Lebanon (19.8%, a difference of 0.15%).
| Demographics | Rating | Rank | Female Poverty Among 18-24 Year Olds |
| Hungarians | 76.6 /100 | #155 | Good 19.8% |
| Immigrants | Belgium | 76.4 /100 | #156 | Good 19.8% |
| Danes | 75.5 /100 | #157 | Good 19.8% |
| Immigrants | Lebanon | 75.3 /100 | #158 | Good 19.8% |
| Trinidadians and Tobagonians | 74.4 /100 | #159 | Good 19.8% |
| Pakistanis | 74.1 /100 | #160 | Good 19.8% |
| Immigrants | Belize | 74.1 /100 | #161 | Good 19.8% |
| French Canadians | 73.0 /100 | #162 | Good 19.9% |
| Malaysians | 72.7 /100 | #163 | Good 19.9% |
| Central Americans | 70.0 /100 | #164 | Good 19.9% |
| Eastern Europeans | 69.3 /100 | #165 | Good 19.9% |
| Belgians | 69.1 /100 | #166 | Good 19.9% |
| Czechoslovakians | 61.8 /100 | #167 | Good 20.0% |
| Fijians | 59.1 /100 | #168 | Average 20.0% |
| Hmong | 55.4 /100 | #169 | Average 20.0% |
Demographics Similar to Burmese by Female Poverty Among 18-24 Year Olds
In terms of female poverty among 18-24 year olds, the demographic groups most similar to Burmese are Immigrants from Armenia (18.9%, a difference of 0.030%), Immigrants from Iraq (18.9%, a difference of 0.11%), Immigrants from Jamaica (18.9%, a difference of 0.12%), Croatian (19.0%, a difference of 0.27%), and Immigrants from Indonesia (18.9%, a difference of 0.29%).
| Demographics | Rating | Rank | Female Poverty Among 18-24 Year Olds |
| Costa Ricans | 99.5 /100 | #77 | Exceptional 18.8% |
| Immigrants | Europe | 99.5 /100 | #78 | Exceptional 18.8% |
| Uruguayans | 99.5 /100 | #79 | Exceptional 18.8% |
| Palestinians | 99.5 /100 | #80 | Exceptional 18.8% |
| Japanese | 99.5 /100 | #81 | Exceptional 18.8% |
| Immigrants | Uruguay | 99.4 /100 | #82 | Exceptional 18.8% |
| Immigrants | Indonesia | 99.4 /100 | #83 | Exceptional 18.9% |
| Burmese | 99.2 /100 | #84 | Exceptional 18.9% |
| Immigrants | Armenia | 99.2 /100 | #85 | Exceptional 18.9% |
| Immigrants | Iraq | 99.2 /100 | #86 | Exceptional 18.9% |
| Immigrants | Jamaica | 99.2 /100 | #87 | Exceptional 18.9% |
| Croatians | 99.1 /100 | #88 | Exceptional 19.0% |
| Immigrants | Cabo Verde | 99.0 /100 | #89 | Exceptional 19.0% |
| Afghans | 99.0 /100 | #90 | Exceptional 19.0% |
| Romanians | 98.9 /100 | #91 | Exceptional 19.0% |