Finnish vs Danish Child Poverty Among Girls Under 16
COMPARE
Finnish
Danish
Child Poverty Among Girls Under 16
Child Poverty Among Girls Under 16 Comparison
Finns
Danes
14.8%
CHILD POVERTY AMONG GIRLS UNDER 16
97.2/ 100
METRIC RATING
87th/ 347
METRIC RANK
13.7%
CHILD POVERTY AMONG GIRLS UNDER 16
99.7/ 100
METRIC RATING
32nd/ 347
METRIC RANK
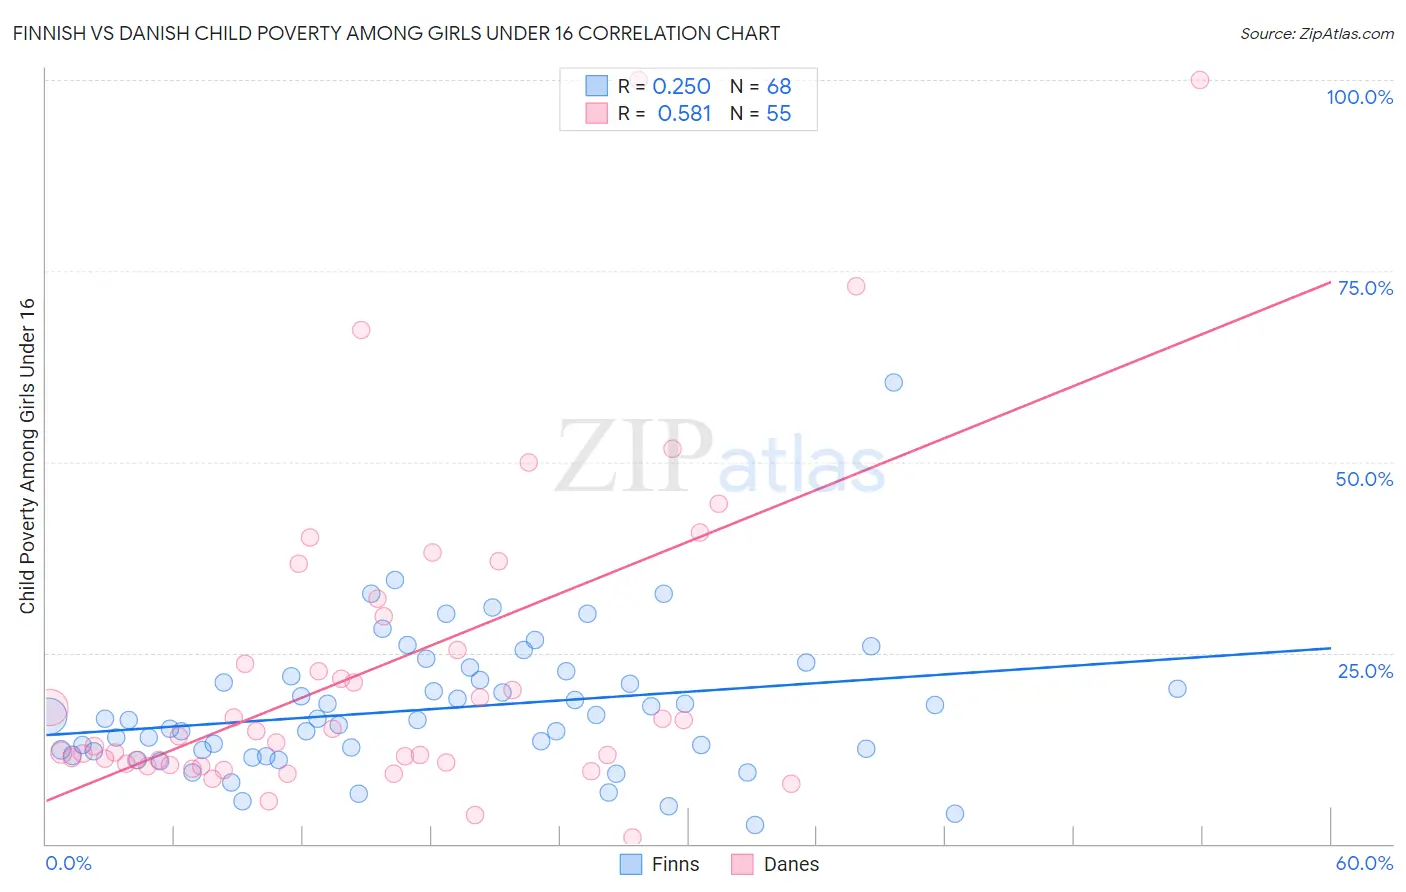
Finnish vs Danish Child Poverty Among Girls Under 16 Correlation Chart
The statistical analysis conducted on geographies consisting of 395,065,953 people shows a weak positive correlation between the proportion of Finns and poverty level among girls under the age of 16 in the United States with a correlation coefficient (R) of 0.250 and weighted average of 14.8%. Similarly, the statistical analysis conducted on geographies consisting of 460,459,007 people shows a substantial positive correlation between the proportion of Danes and poverty level among girls under the age of 16 in the United States with a correlation coefficient (R) of 0.581 and weighted average of 13.7%, a difference of 8.1%.
Child Poverty Among Girls Under 16 Correlation Summary
| Measurement | Finnish | Danish |
| Minimum | 2.4% | 0.79% |
| Maximum | 60.3% | 100.0% |
| Range | 57.9% | 99.2% |
| Mean | 17.7% | 23.1% |
| Median | 16.3% | 14.1% |
| Interquartile 25% (IQ1) | 12.2% | 10.5% |
| Interquartile 75% (IQ3) | 21.7% | 29.7% |
| Interquartile Range (IQR) | 9.5% | 19.2% |
| Standard Deviation (Sample) | 9.0% | 21.5% |
| Standard Deviation (Population) | 9.0% | 21.3% |
Similar Demographics by Child Poverty Among Girls Under 16
Demographics Similar to Finns by Child Poverty Among Girls Under 16
In terms of child poverty among girls under 16, the demographic groups most similar to Finns are Australian (14.8%, a difference of 0.020%), Swiss (14.8%, a difference of 0.060%), Immigrants from Canada (14.8%, a difference of 0.070%), Jordanian (14.8%, a difference of 0.12%), and Northern European (14.8%, a difference of 0.14%).
| Demographics | Rating | Rank | Child Poverty Among Girls Under 16 |
| Egyptians | 97.9 /100 | #80 | Exceptional 14.7% |
| Ukrainians | 97.7 /100 | #81 | Exceptional 14.7% |
| Macedonians | 97.6 /100 | #82 | Exceptional 14.7% |
| Immigrants | Italy | 97.4 /100 | #83 | Exceptional 14.8% |
| Soviet Union | 97.3 /100 | #84 | Exceptional 14.8% |
| Swiss | 97.2 /100 | #85 | Exceptional 14.8% |
| Australians | 97.2 /100 | #86 | Exceptional 14.8% |
| Finns | 97.2 /100 | #87 | Exceptional 14.8% |
| Immigrants | Canada | 97.1 /100 | #88 | Exceptional 14.8% |
| Jordanians | 97.1 /100 | #89 | Exceptional 14.8% |
| Northern Europeans | 97.0 /100 | #90 | Exceptional 14.8% |
| Immigrants | Belarus | 97.0 /100 | #91 | Exceptional 14.8% |
| Austrians | 96.7 /100 | #92 | Exceptional 14.9% |
| Immigrants | North America | 96.6 /100 | #93 | Exceptional 14.9% |
| Immigrants | Switzerland | 96.3 /100 | #94 | Exceptional 14.9% |
Demographics Similar to Danes by Child Poverty Among Girls Under 16
In terms of child poverty among girls under 16, the demographic groups most similar to Danes are Swedish (13.7%, a difference of 0.030%), Turkish (13.7%, a difference of 0.040%), Maltese (13.7%, a difference of 0.080%), Asian (13.7%, a difference of 0.16%), and Bolivian (13.6%, a difference of 0.83%).
| Demographics | Rating | Rank | Child Poverty Among Girls Under 16 |
| Immigrants | China | 99.8 /100 | #25 | Exceptional 13.4% |
| Eastern Europeans | 99.8 /100 | #26 | Exceptional 13.5% |
| Latvians | 99.8 /100 | #27 | Exceptional 13.5% |
| Tongans | 99.8 /100 | #28 | Exceptional 13.6% |
| Bolivians | 99.8 /100 | #29 | Exceptional 13.6% |
| Asians | 99.7 /100 | #30 | Exceptional 13.7% |
| Turks | 99.7 /100 | #31 | Exceptional 13.7% |
| Danes | 99.7 /100 | #32 | Exceptional 13.7% |
| Swedes | 99.7 /100 | #33 | Exceptional 13.7% |
| Maltese | 99.7 /100 | #34 | Exceptional 13.7% |
| Immigrants | Northern Europe | 99.6 /100 | #35 | Exceptional 13.8% |
| Russians | 99.6 /100 | #36 | Exceptional 13.9% |
| Lithuanians | 99.6 /100 | #37 | Exceptional 13.9% |
| Immigrants | Moldova | 99.6 /100 | #38 | Exceptional 13.9% |
| Immigrants | Australia | 99.5 /100 | #39 | Exceptional 14.0% |