Finnish vs Danish Unemployment Among Ages 20 to 24 years
COMPARE
Finnish
Danish
Unemployment Among Ages 20 to 24 years
Unemployment Among Ages 20 to 24 years Comparison
Finns
Danes
9.7%
UNEMPLOYMENT AMONG AGES 20 TO 24 YEARS
99.8/ 100
METRIC RATING
48th/ 347
METRIC RANK
9.3%
UNEMPLOYMENT AMONG AGES 20 TO 24 YEARS
100.0/ 100
METRIC RATING
16th/ 347
METRIC RANK
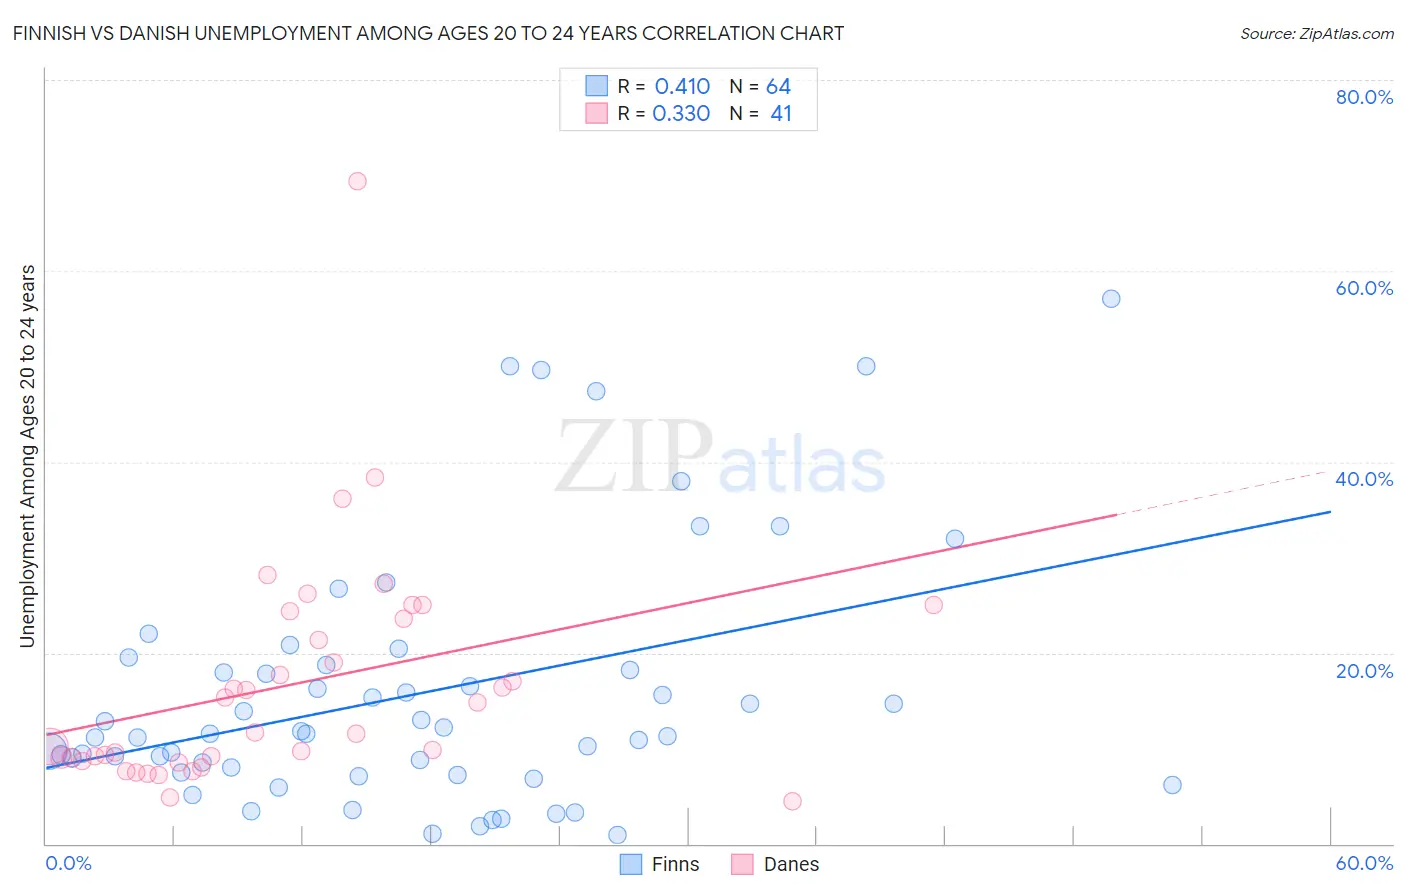
Finnish vs Danish Unemployment Among Ages 20 to 24 years Correlation Chart
The statistical analysis conducted on geographies consisting of 386,709,686 people shows a moderate positive correlation between the proportion of Finns and unemployment rate among population between the ages 20 and 24 in the United States with a correlation coefficient (R) of 0.410 and weighted average of 9.7%. Similarly, the statistical analysis conducted on geographies consisting of 447,112,661 people shows a mild positive correlation between the proportion of Danes and unemployment rate among population between the ages 20 and 24 in the United States with a correlation coefficient (R) of 0.330 and weighted average of 9.3%, a difference of 4.8%.
Unemployment Among Ages 20 to 24 years Correlation Summary
| Measurement | Finnish | Danish |
| Minimum | 0.90% | 4.5% |
| Maximum | 57.1% | 69.4% |
| Range | 56.2% | 64.9% |
| Mean | 15.8% | 16.6% |
| Median | 11.6% | 11.6% |
| Interquartile 25% (IQ1) | 7.7% | 8.9% |
| Interquartile 75% (IQ3) | 18.4% | 23.9% |
| Interquartile Range (IQR) | 10.7% | 15.1% |
| Standard Deviation (Sample) | 13.1% | 12.0% |
| Standard Deviation (Population) | 13.0% | 11.8% |
Similar Demographics by Unemployment Among Ages 20 to 24 years
Demographics Similar to Finns by Unemployment Among Ages 20 to 24 years
In terms of unemployment among ages 20 to 24 years, the demographic groups most similar to Finns are Immigrants from India (9.7%, a difference of 0.010%), Creek (9.7%, a difference of 0.080%), Immigrants from Nicaragua (9.7%, a difference of 0.13%), Croatian (9.7%, a difference of 0.14%), and European (9.7%, a difference of 0.20%).
| Demographics | Rating | Rank | Unemployment Among Ages 20 to 24 years |
| Swiss | 99.9 /100 | #41 | Exceptional 9.7% |
| Immigrants | Saudi Arabia | 99.9 /100 | #42 | Exceptional 9.7% |
| Menominee | 99.8 /100 | #43 | Exceptional 9.7% |
| Europeans | 99.8 /100 | #44 | Exceptional 9.7% |
| Croatians | 99.8 /100 | #45 | Exceptional 9.7% |
| Immigrants | Nicaragua | 99.8 /100 | #46 | Exceptional 9.7% |
| Immigrants | India | 99.8 /100 | #47 | Exceptional 9.7% |
| Finns | 99.8 /100 | #48 | Exceptional 9.7% |
| Creek | 99.8 /100 | #49 | Exceptional 9.7% |
| Immigrants | Kenya | 99.7 /100 | #50 | Exceptional 9.7% |
| Ethiopians | 99.7 /100 | #51 | Exceptional 9.8% |
| Immigrants | Thailand | 99.7 /100 | #52 | Exceptional 9.8% |
| Immigrants | Serbia | 99.6 /100 | #53 | Exceptional 9.8% |
| Immigrants | Cambodia | 99.6 /100 | #54 | Exceptional 9.8% |
| Carpatho Rusyns | 99.6 /100 | #55 | Exceptional 9.8% |
Demographics Similar to Danes by Unemployment Among Ages 20 to 24 years
In terms of unemployment among ages 20 to 24 years, the demographic groups most similar to Danes are Immigrants from Sudan (9.3%, a difference of 0.16%), Slovene (9.3%, a difference of 0.19%), Czech (9.3%, a difference of 0.51%), Immigrants from Congo (9.2%, a difference of 0.57%), and Cuban (9.2%, a difference of 0.65%).
| Demographics | Rating | Rank | Unemployment Among Ages 20 to 24 years |
| Immigrants | Somalia | 100.0 /100 | #9 | Exceptional 9.2% |
| Sudanese | 100.0 /100 | #10 | Exceptional 9.2% |
| Zimbabweans | 100.0 /100 | #11 | Exceptional 9.2% |
| Cubans | 100.0 /100 | #12 | Exceptional 9.2% |
| Immigrants | Congo | 100.0 /100 | #13 | Exceptional 9.2% |
| Slovenes | 100.0 /100 | #14 | Exceptional 9.3% |
| Immigrants | Sudan | 100.0 /100 | #15 | Exceptional 9.3% |
| Danes | 100.0 /100 | #16 | Exceptional 9.3% |
| Czechs | 100.0 /100 | #17 | Exceptional 9.3% |
| Chinese | 100.0 /100 | #18 | Exceptional 9.4% |
| Hmong | 100.0 /100 | #19 | Exceptional 9.4% |
| Osage | 100.0 /100 | #20 | Exceptional 9.4% |
| Immigrants | Bosnia and Herzegovina | 100.0 /100 | #21 | Exceptional 9.4% |
| Tongans | 100.0 /100 | #22 | Exceptional 9.4% |
| Immigrants | Nepal | 100.0 /100 | #23 | Exceptional 9.4% |