Menominee vs Alsatian Female Poverty Among 18-24 Year Olds
COMPARE
Menominee
Alsatian
Female Poverty Among 18-24 Year Olds
Female Poverty Among 18-24 Year Olds Comparison
Menominee
Alsatians
22.5%
FEMALE POVERTY AMONG 18-24 YEAR OLDS
0.0/ 100
METRIC RATING
296th/ 347
METRIC RANK
24.4%
FEMALE POVERTY AMONG 18-24 YEAR OLDS
0.0/ 100
METRIC RATING
316th/ 347
METRIC RANK
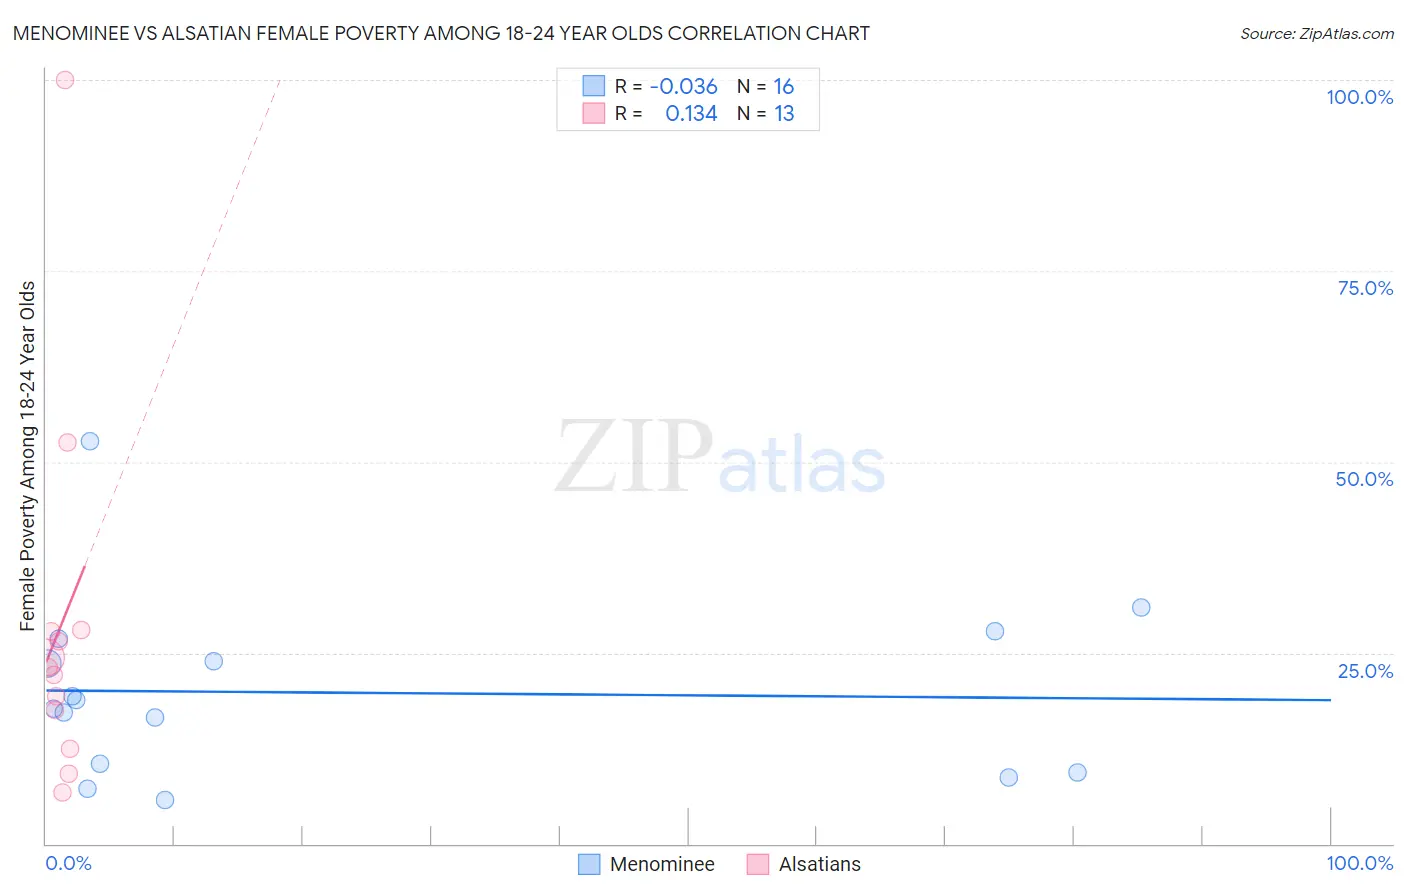
Menominee vs Alsatian Female Poverty Among 18-24 Year Olds Correlation Chart
The statistical analysis conducted on geographies consisting of 45,483,938 people shows no correlation between the proportion of Menominee and poverty level among females between the ages 18 and 24 in the United States with a correlation coefficient (R) of -0.036 and weighted average of 22.5%. Similarly, the statistical analysis conducted on geographies consisting of 81,760,861 people shows a poor positive correlation between the proportion of Alsatians and poverty level among females between the ages 18 and 24 in the United States with a correlation coefficient (R) of 0.134 and weighted average of 24.4%, a difference of 8.2%.
Female Poverty Among 18-24 Year Olds Correlation Summary
| Measurement | Menominee | Alsatian |
| Minimum | 5.7% | 6.7% |
| Maximum | 52.7% | 100.0% |
| Range | 47.0% | 93.3% |
| Mean | 19.8% | 28.4% |
| Median | 18.2% | 23.1% |
| Interquartile 25% (IQ1) | 9.9% | 15.0% |
| Interquartile 75% (IQ3) | 25.3% | 27.9% |
| Interquartile Range (IQR) | 15.4% | 12.9% |
| Standard Deviation (Sample) | 11.7% | 24.3% |
| Standard Deviation (Population) | 11.3% | 23.3% |
Demographics Similar to Menominee and Alsatians by Female Poverty Among 18-24 Year Olds
In terms of female poverty among 18-24 year olds, the demographic groups most similar to Menominee are Inupiat (22.6%, a difference of 0.14%), Central American Indian (22.6%, a difference of 0.21%), Cherokee (22.7%, a difference of 0.62%), African (22.8%, a difference of 1.3%), and Seminole (22.9%, a difference of 1.4%). Similarly, the demographic groups most similar to Alsatians are Black/African American (24.3%, a difference of 0.31%), Choctaw (24.3%, a difference of 0.51%), Creek (24.2%, a difference of 0.67%), Yuman (24.0%, a difference of 1.7%), and Potawatomi (23.7%, a difference of 2.9%).
| Demographics | Rating | Rank | Female Poverty Among 18-24 Year Olds |
| Menominee | 0.0 /100 | #296 | Tragic 22.5% |
| Inupiat | 0.0 /100 | #297 | Tragic 22.6% |
| Central American Indians | 0.0 /100 | #298 | Tragic 22.6% |
| Cherokee | 0.0 /100 | #299 | Tragic 22.7% |
| Africans | 0.0 /100 | #300 | Tragic 22.8% |
| Seminole | 0.0 /100 | #301 | Tragic 22.9% |
| Iroquois | 0.0 /100 | #302 | Tragic 22.9% |
| Senegalese | 0.0 /100 | #303 | Tragic 23.0% |
| Sudanese | 0.0 /100 | #304 | Tragic 23.0% |
| Immigrants | Kuwait | 0.0 /100 | #305 | Tragic 23.0% |
| Paiute | 0.0 /100 | #306 | Tragic 23.3% |
| Cree | 0.0 /100 | #307 | Tragic 23.4% |
| Immigrants | Sudan | 0.0 /100 | #308 | Tragic 23.5% |
| Blackfeet | 0.0 /100 | #309 | Tragic 23.6% |
| Comanche | 0.0 /100 | #310 | Tragic 23.6% |
| Potawatomi | 0.0 /100 | #311 | Tragic 23.7% |
| Yuman | 0.0 /100 | #312 | Tragic 24.0% |
| Creek | 0.0 /100 | #313 | Tragic 24.2% |
| Choctaw | 0.0 /100 | #314 | Tragic 24.3% |
| Blacks/African Americans | 0.0 /100 | #315 | Tragic 24.3% |
| Alsatians | 0.0 /100 | #316 | Tragic 24.4% |