European vs U.S. Virgin Islander Unemployment Among Ages 30 to 34 years
COMPARE
European
U.S. Virgin Islander
Unemployment Among Ages 30 to 34 years
Unemployment Among Ages 30 to 34 years Comparison
Europeans
U.S. Virgin Islanders
5.2%
UNEMPLOYMENT AMONG AGES 30 TO 34 YEARS
91.7/ 100
METRIC RATING
97th/ 347
METRIC RANK
6.3%
UNEMPLOYMENT AMONG AGES 30 TO 34 YEARS
0.0/ 100
METRIC RATING
274th/ 347
METRIC RANK
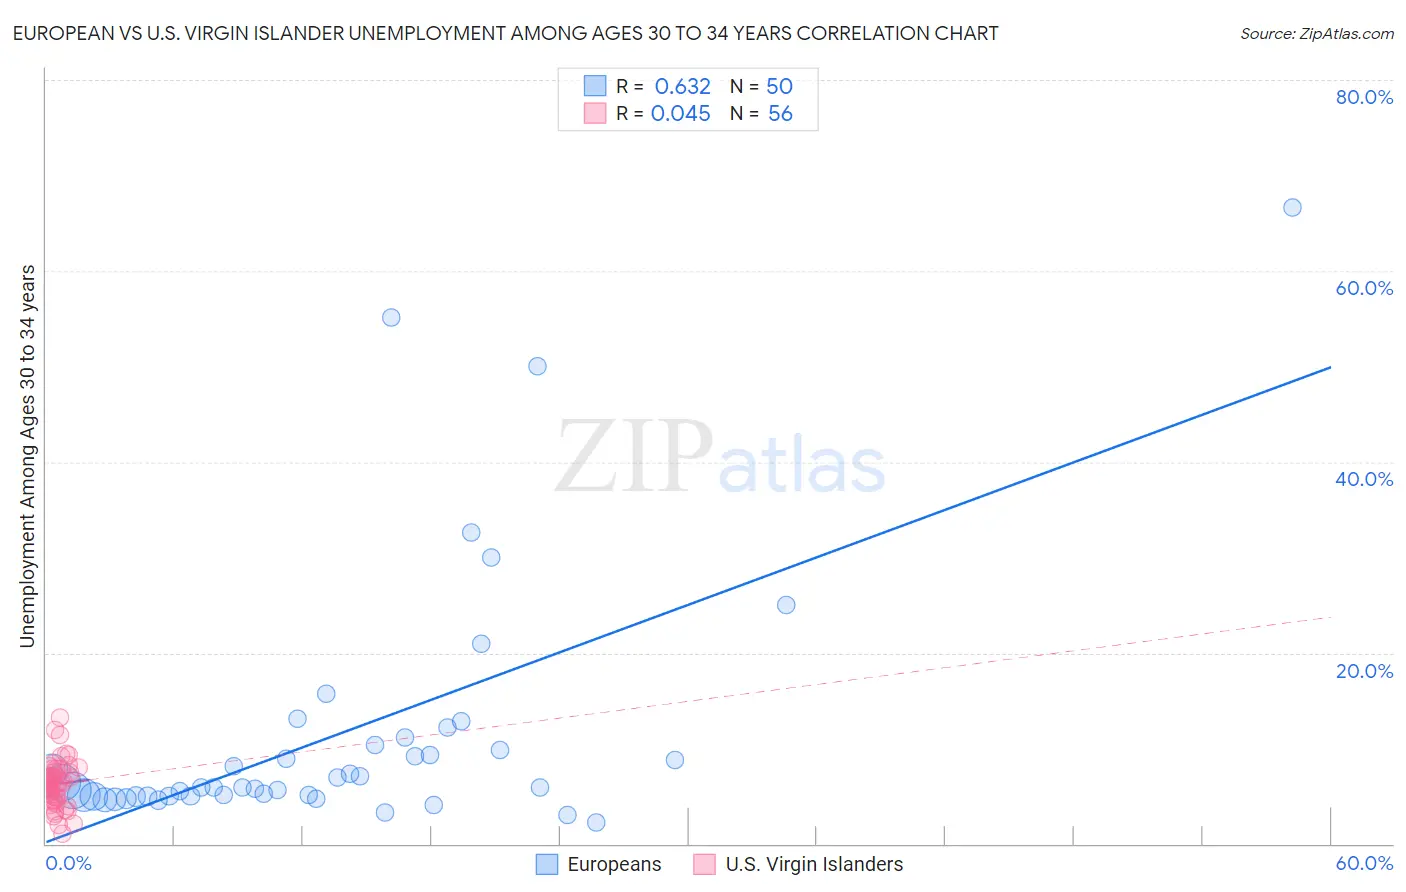
European vs U.S. Virgin Islander Unemployment Among Ages 30 to 34 years Correlation Chart
The statistical analysis conducted on geographies consisting of 493,255,737 people shows a significant positive correlation between the proportion of Europeans and unemployment rate among population between the ages 30 and 34 in the United States with a correlation coefficient (R) of 0.632 and weighted average of 5.2%. Similarly, the statistical analysis conducted on geographies consisting of 86,615,171 people shows no correlation between the proportion of U.S. Virgin Islanders and unemployment rate among population between the ages 30 and 34 in the United States with a correlation coefficient (R) of 0.045 and weighted average of 6.3%, a difference of 19.9%.
Unemployment Among Ages 30 to 34 years Correlation Summary
| Measurement | European | U.S. Virgin Islander |
| Minimum | 2.2% | 1.0% |
| Maximum | 66.7% | 13.2% |
| Range | 64.5% | 12.2% |
| Mean | 11.4% | 6.3% |
| Median | 5.9% | 6.3% |
| Interquartile 25% (IQ1) | 5.0% | 4.8% |
| Interquartile 75% (IQ3) | 10.4% | 7.5% |
| Interquartile Range (IQR) | 5.4% | 2.7% |
| Standard Deviation (Sample) | 13.4% | 2.3% |
| Standard Deviation (Population) | 13.3% | 2.3% |
Similar Demographics by Unemployment Among Ages 30 to 34 years
Demographics Similar to Europeans by Unemployment Among Ages 30 to 34 years
In terms of unemployment among ages 30 to 34 years, the demographic groups most similar to Europeans are Mongolian (5.2%, a difference of 0.010%), Kenyan (5.2%, a difference of 0.10%), Laotian (5.2%, a difference of 0.17%), Maltese (5.2%, a difference of 0.17%), and Immigrants from North Macedonia (5.2%, a difference of 0.18%).
| Demographics | Rating | Rank | Unemployment Among Ages 30 to 34 years |
| Immigrants | Romania | 92.8 /100 | #90 | Exceptional 5.2% |
| Iraqis | 92.6 /100 | #91 | Exceptional 5.2% |
| Immigrants | Argentina | 92.5 /100 | #92 | Exceptional 5.2% |
| Laotians | 92.4 /100 | #93 | Exceptional 5.2% |
| Maltese | 92.3 /100 | #94 | Exceptional 5.2% |
| Kenyans | 92.1 /100 | #95 | Exceptional 5.2% |
| Mongolians | 91.7 /100 | #96 | Exceptional 5.2% |
| Europeans | 91.7 /100 | #97 | Exceptional 5.2% |
| Immigrants | North Macedonia | 90.9 /100 | #98 | Exceptional 5.2% |
| Immigrants | Ireland | 90.6 /100 | #99 | Exceptional 5.2% |
| Immigrants | Czechoslovakia | 89.5 /100 | #100 | Excellent 5.3% |
| British | 89.1 /100 | #101 | Excellent 5.3% |
| Immigrants | Switzerland | 88.8 /100 | #102 | Excellent 5.3% |
| Immigrants | Jordan | 88.8 /100 | #103 | Excellent 5.3% |
| Northern Europeans | 87.9 /100 | #104 | Excellent 5.3% |
Demographics Similar to U.S. Virgin Islanders by Unemployment Among Ages 30 to 34 years
In terms of unemployment among ages 30 to 34 years, the demographic groups most similar to U.S. Virgin Islanders are Ottawa (6.3%, a difference of 0.010%), Blackfeet (6.3%, a difference of 0.020%), Ecuadorian (6.3%, a difference of 0.10%), Comanche (6.3%, a difference of 0.13%), and Pennsylvania German (6.3%, a difference of 0.16%).
| Demographics | Rating | Rank | Unemployment Among Ages 30 to 34 years |
| Immigrants | Mexico | 0.0 /100 | #267 | Tragic 6.2% |
| Immigrants | Haiti | 0.0 /100 | #268 | Tragic 6.2% |
| French American Indians | 0.0 /100 | #269 | Tragic 6.3% |
| Immigrants | Senegal | 0.0 /100 | #270 | Tragic 6.3% |
| Comanche | 0.0 /100 | #271 | Tragic 6.3% |
| Blackfeet | 0.0 /100 | #272 | Tragic 6.3% |
| Ottawa | 0.0 /100 | #273 | Tragic 6.3% |
| U.S. Virgin Islanders | 0.0 /100 | #274 | Tragic 6.3% |
| Ecuadorians | 0.0 /100 | #275 | Tragic 6.3% |
| Pennsylvania Germans | 0.0 /100 | #276 | Tragic 6.3% |
| Immigrants | Ecuador | 0.0 /100 | #277 | Tragic 6.3% |
| Osage | 0.0 /100 | #278 | Tragic 6.3% |
| Cree | 0.0 /100 | #279 | Tragic 6.4% |
| Cherokee | 0.0 /100 | #280 | Tragic 6.4% |
| Immigrants | Caribbean | 0.0 /100 | #281 | Tragic 6.4% |