European vs Asian Female Poverty Among 18-24 Year Olds
COMPARE
European
Asian
Female Poverty Among 18-24 Year Olds
Female Poverty Among 18-24 Year Olds Comparison
Europeans
Asians
20.4%
FEMALE POVERTY AMONG 18-24 YEAR OLDS
19.9/ 100
METRIC RATING
200th/ 347
METRIC RANK
18.2%
FEMALE POVERTY AMONG 18-24 YEAR OLDS
100.0/ 100
METRIC RATING
47th/ 347
METRIC RANK
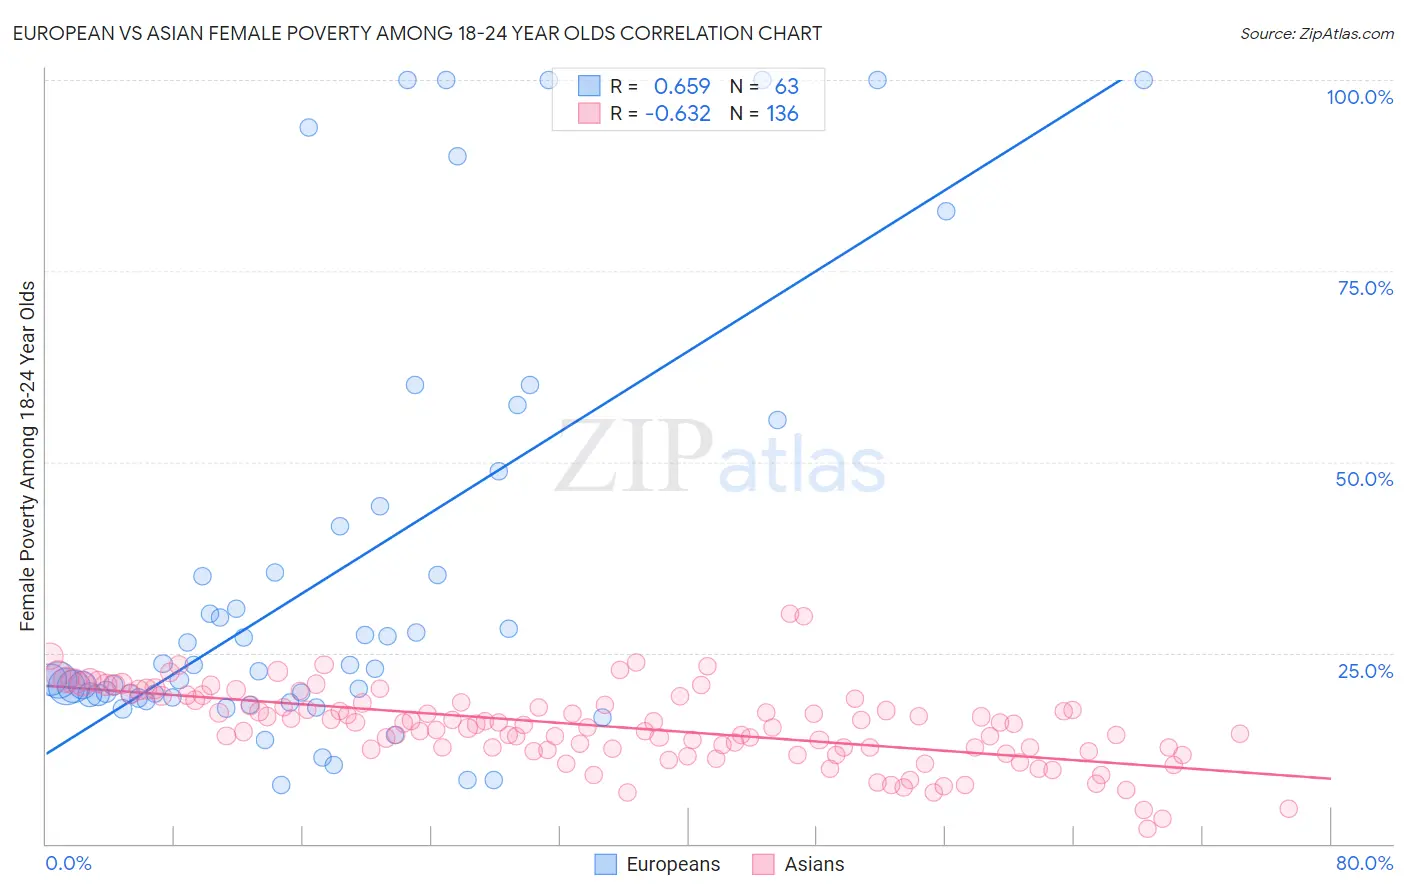
European vs Asian Female Poverty Among 18-24 Year Olds Correlation Chart
The statistical analysis conducted on geographies consisting of 530,028,341 people shows a significant positive correlation between the proportion of Europeans and poverty level among females between the ages 18 and 24 in the United States with a correlation coefficient (R) of 0.659 and weighted average of 20.4%. Similarly, the statistical analysis conducted on geographies consisting of 523,051,207 people shows a significant negative correlation between the proportion of Asians and poverty level among females between the ages 18 and 24 in the United States with a correlation coefficient (R) of -0.632 and weighted average of 18.2%, a difference of 12.4%.
Female Poverty Among 18-24 Year Olds Correlation Summary
| Measurement | European | Asian |
| Minimum | 7.7% | 1.9% |
| Maximum | 100.0% | 30.1% |
| Range | 92.3% | 28.2% |
| Mean | 35.4% | 15.4% |
| Median | 22.9% | 15.7% |
| Interquartile 25% (IQ1) | 19.2% | 12.4% |
| Interquartile 75% (IQ3) | 41.6% | 18.9% |
| Interquartile Range (IQR) | 22.4% | 6.5% |
| Standard Deviation (Sample) | 27.7% | 5.0% |
| Standard Deviation (Population) | 27.5% | 5.0% |
Similar Demographics by Female Poverty Among 18-24 Year Olds
Demographics Similar to Europeans by Female Poverty Among 18-24 Year Olds
In terms of female poverty among 18-24 year olds, the demographic groups most similar to Europeans are German (20.4%, a difference of 0.050%), Immigrants from Spain (20.4%, a difference of 0.060%), Zimbabwean (20.4%, a difference of 0.080%), Mexican (20.5%, a difference of 0.13%), and Czech (20.4%, a difference of 0.17%).
| Demographics | Rating | Rank | Female Poverty Among 18-24 Year Olds |
| Nigerians | 23.4 /100 | #193 | Fair 20.4% |
| Mexican American Indians | 23.2 /100 | #194 | Fair 20.4% |
| Immigrants | Latvia | 23.0 /100 | #195 | Fair 20.4% |
| Czechs | 22.3 /100 | #196 | Fair 20.4% |
| Zimbabweans | 21.0 /100 | #197 | Fair 20.4% |
| Immigrants | Spain | 20.7 /100 | #198 | Fair 20.4% |
| Germans | 20.6 /100 | #199 | Fair 20.4% |
| Europeans | 19.9 /100 | #200 | Poor 20.4% |
| Mexicans | 18.3 /100 | #201 | Poor 20.5% |
| Immigrants | Turkey | 17.7 /100 | #202 | Poor 20.5% |
| Immigrants | Malaysia | 17.2 /100 | #203 | Poor 20.5% |
| Immigrants | Netherlands | 17.0 /100 | #204 | Poor 20.5% |
| English | 16.7 /100 | #205 | Poor 20.5% |
| Hispanics or Latinos | 16.6 /100 | #206 | Poor 20.5% |
| Spaniards | 16.3 /100 | #207 | Poor 20.5% |
Demographics Similar to Asians by Female Poverty Among 18-24 Year Olds
In terms of female poverty among 18-24 year olds, the demographic groups most similar to Asians are Sri Lankan (18.2%, a difference of 0.050%), Immigrants from Southern Europe (18.2%, a difference of 0.080%), Bhutanese (18.2%, a difference of 0.080%), Samoan (18.2%, a difference of 0.19%), and Immigrants from Eastern Europe (18.2%, a difference of 0.36%).
| Demographics | Rating | Rank | Female Poverty Among 18-24 Year Olds |
| Immigrants | Romania | 100.0 /100 | #40 | Exceptional 18.0% |
| Immigrants | Argentina | 100.0 /100 | #41 | Exceptional 18.0% |
| Bulgarians | 100.0 /100 | #42 | Exceptional 18.1% |
| Macedonians | 100.0 /100 | #43 | Exceptional 18.1% |
| Nicaraguans | 100.0 /100 | #44 | Exceptional 18.1% |
| Spanish American Indians | 100.0 /100 | #45 | Exceptional 18.1% |
| Immigrants | Southern Europe | 100.0 /100 | #46 | Exceptional 18.2% |
| Asians | 100.0 /100 | #47 | Exceptional 18.2% |
| Sri Lankans | 100.0 /100 | #48 | Exceptional 18.2% |
| Bhutanese | 100.0 /100 | #49 | Exceptional 18.2% |
| Samoans | 100.0 /100 | #50 | Exceptional 18.2% |
| Immigrants | Eastern Europe | 99.9 /100 | #51 | Exceptional 18.2% |
| Immigrants | Ireland | 99.9 /100 | #52 | Exceptional 18.3% |
| Italians | 99.9 /100 | #53 | Exceptional 18.3% |
| Immigrants | Egypt | 99.9 /100 | #54 | Exceptional 18.4% |