Egyptian vs Immigrants from Kenya Child Poverty Among Girls Under 16
COMPARE
Egyptian
Immigrants from Kenya
Child Poverty Among Girls Under 16
Child Poverty Among Girls Under 16 Comparison
Egyptians
Immigrants from Kenya
14.7%
CHILD POVERTY AMONG GIRLS UNDER 16
97.9/ 100
METRIC RATING
80th/ 347
METRIC RANK
17.2%
CHILD POVERTY AMONG GIRLS UNDER 16
17.8/ 100
METRIC RATING
201st/ 347
METRIC RANK
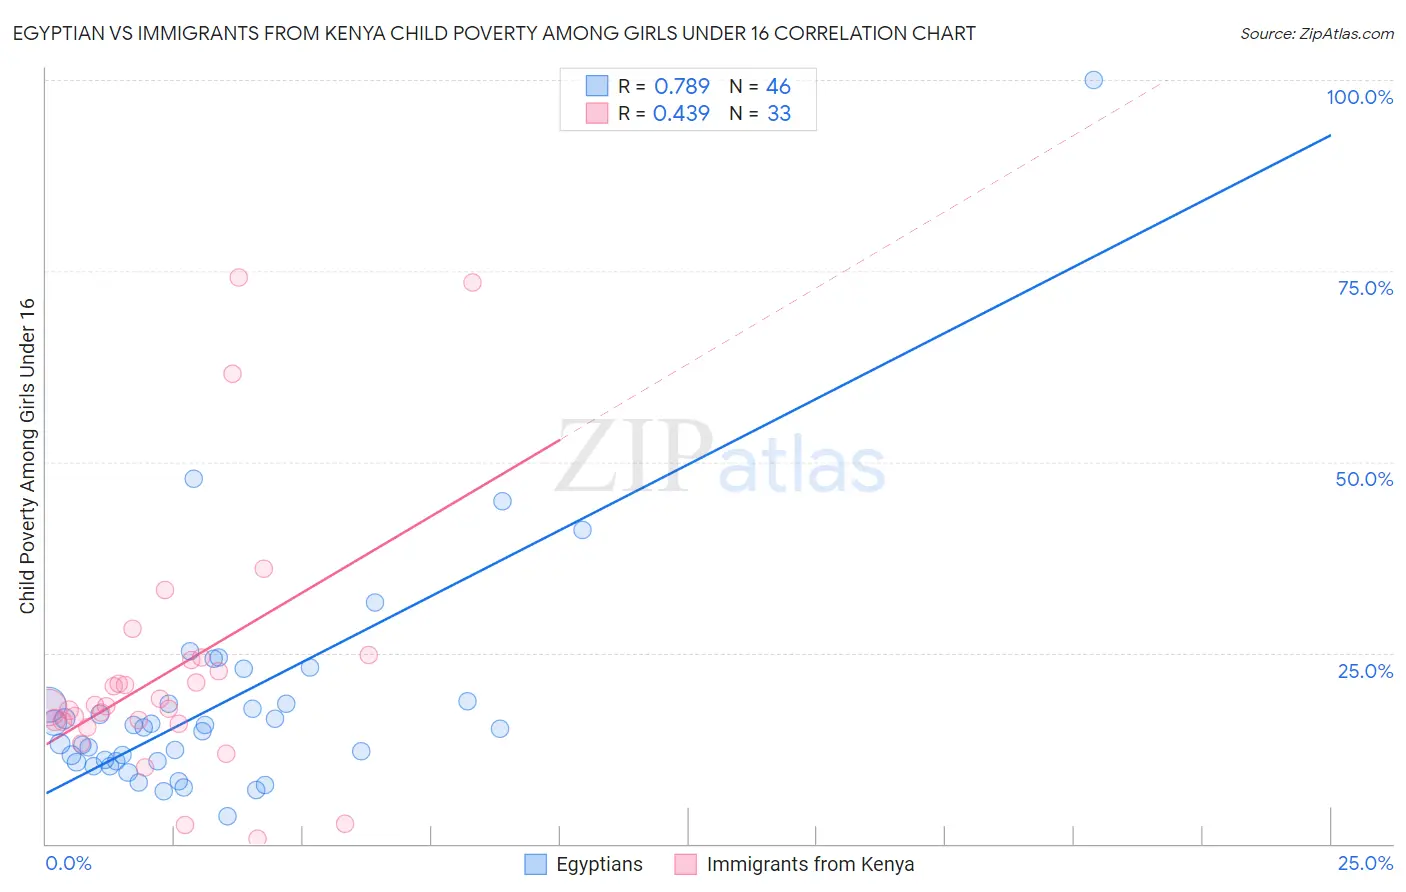
Egyptian vs Immigrants from Kenya Child Poverty Among Girls Under 16 Correlation Chart
The statistical analysis conducted on geographies consisting of 273,353,549 people shows a strong positive correlation between the proportion of Egyptians and poverty level among girls under the age of 16 in the United States with a correlation coefficient (R) of 0.789 and weighted average of 14.7%. Similarly, the statistical analysis conducted on geographies consisting of 216,258,173 people shows a moderate positive correlation between the proportion of Immigrants from Kenya and poverty level among girls under the age of 16 in the United States with a correlation coefficient (R) of 0.439 and weighted average of 17.2%, a difference of 17.3%.
Child Poverty Among Girls Under 16 Correlation Summary
| Measurement | Egyptian | Immigrants from Kenya |
| Minimum | 3.6% | 0.70% |
| Maximum | 100.0% | 74.2% |
| Range | 96.4% | 73.5% |
| Mean | 18.3% | 22.6% |
| Median | 15.2% | 18.0% |
| Interquartile 25% (IQ1) | 10.8% | 15.8% |
| Interquartile 75% (IQ3) | 18.3% | 24.2% |
| Interquartile Range (IQR) | 7.6% | 8.4% |
| Standard Deviation (Sample) | 15.5% | 16.9% |
| Standard Deviation (Population) | 15.3% | 16.7% |
Similar Demographics by Child Poverty Among Girls Under 16
Demographics Similar to Egyptians by Child Poverty Among Girls Under 16
In terms of child poverty among girls under 16, the demographic groups most similar to Egyptians are Immigrants from Turkey (14.7%, a difference of 0.0%), Argentinean (14.7%, a difference of 0.020%), Tlingit-Haida (14.7%, a difference of 0.030%), Immigrants from Russia (14.7%, a difference of 0.040%), and Immigrants from Eastern Europe (14.6%, a difference of 0.18%).
| Demographics | Rating | Rank | Child Poverty Among Girls Under 16 |
| Immigrants | Austria | 98.0 /100 | #73 | Exceptional 14.6% |
| Taiwanese | 98.0 /100 | #74 | Exceptional 14.6% |
| Immigrants | Eastern Europe | 98.0 /100 | #75 | Exceptional 14.6% |
| Immigrants | Russia | 97.9 /100 | #76 | Exceptional 14.7% |
| Tlingit-Haida | 97.9 /100 | #77 | Exceptional 14.7% |
| Argentineans | 97.9 /100 | #78 | Exceptional 14.7% |
| Immigrants | Turkey | 97.9 /100 | #79 | Exceptional 14.7% |
| Egyptians | 97.9 /100 | #80 | Exceptional 14.7% |
| Ukrainians | 97.7 /100 | #81 | Exceptional 14.7% |
| Macedonians | 97.6 /100 | #82 | Exceptional 14.7% |
| Immigrants | Italy | 97.4 /100 | #83 | Exceptional 14.8% |
| Soviet Union | 97.3 /100 | #84 | Exceptional 14.8% |
| Swiss | 97.2 /100 | #85 | Exceptional 14.8% |
| Australians | 97.2 /100 | #86 | Exceptional 14.8% |
| Finns | 97.2 /100 | #87 | Exceptional 14.8% |
Demographics Similar to Immigrants from Kenya by Child Poverty Among Girls Under 16
In terms of child poverty among girls under 16, the demographic groups most similar to Immigrants from Kenya are Immigrants from Sierra Leone (17.2%, a difference of 0.050%), Ugandan (17.2%, a difference of 0.060%), Immigrants from Uzbekistan (17.1%, a difference of 0.64%), Immigrants from Afghanistan (17.1%, a difference of 0.79%), and Immigrants from Lebanon (17.1%, a difference of 0.82%).
| Demographics | Rating | Rank | Child Poverty Among Girls Under 16 |
| Spanish | 28.6 /100 | #194 | Fair 16.9% |
| Immigrants | Costa Rica | 25.6 /100 | #195 | Fair 17.0% |
| Celtics | 25.2 /100 | #196 | Fair 17.0% |
| Spaniards | 24.9 /100 | #197 | Fair 17.0% |
| Immigrants | Lebanon | 22.6 /100 | #198 | Fair 17.1% |
| Immigrants | Afghanistan | 22.4 /100 | #199 | Fair 17.1% |
| Immigrants | Uzbekistan | 21.5 /100 | #200 | Fair 17.1% |
| Immigrants | Kenya | 17.8 /100 | #201 | Poor 17.2% |
| Immigrants | Sierra Leone | 17.6 /100 | #202 | Poor 17.2% |
| Ugandans | 17.5 /100 | #203 | Poor 17.2% |
| Iraqis | 13.0 /100 | #204 | Poor 17.4% |
| Immigrants | Cameroon | 12.6 /100 | #205 | Poor 17.4% |
| Delaware | 11.5 /100 | #206 | Poor 17.4% |
| Hmong | 10.6 /100 | #207 | Poor 17.5% |
| Sierra Leoneans | 8.9 /100 | #208 | Tragic 17.6% |