Egyptian vs Danish Seniors Poverty Over the Age of 65
COMPARE
Egyptian
Danish
Seniors Poverty Over the Age of 65
Seniors Poverty Over the Age of 65 Comparison
Egyptians
Danes
10.5%
SENIORS POVERTY OVER THE AGE OF 65
87.8/ 100
METRIC RATING
131st/ 347
METRIC RANK
8.8%
SENIORS POVERTY OVER THE AGE OF 65
100.0/ 100
METRIC RATING
6th/ 347
METRIC RANK
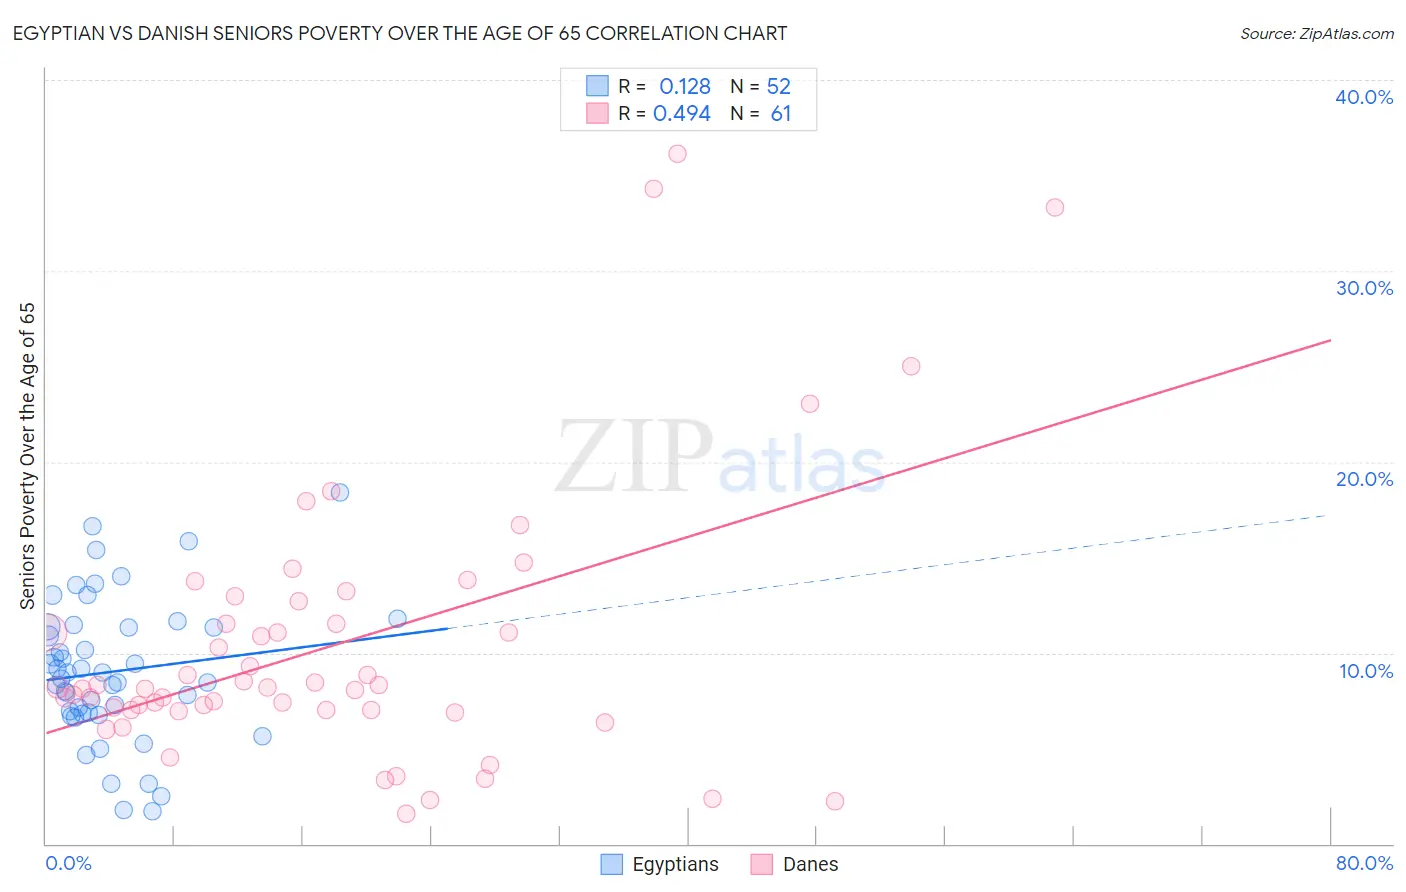
Egyptian vs Danish Seniors Poverty Over the Age of 65 Correlation Chart
The statistical analysis conducted on geographies consisting of 276,181,120 people shows a poor positive correlation between the proportion of Egyptians and poverty level among seniors over the age of 65 in the United States with a correlation coefficient (R) of 0.128 and weighted average of 10.5%. Similarly, the statistical analysis conducted on geographies consisting of 471,575,123 people shows a moderate positive correlation between the proportion of Danes and poverty level among seniors over the age of 65 in the United States with a correlation coefficient (R) of 0.494 and weighted average of 8.8%, a difference of 18.7%.
Seniors Poverty Over the Age of 65 Correlation Summary
| Measurement | Egyptian | Danish |
| Minimum | 1.7% | 1.6% |
| Maximum | 18.4% | 36.1% |
| Range | 16.7% | 34.5% |
| Mean | 9.0% | 10.4% |
| Median | 8.8% | 8.2% |
| Interquartile 25% (IQ1) | 6.8% | 7.0% |
| Interquartile 75% (IQ3) | 11.3% | 12.1% |
| Interquartile Range (IQR) | 4.5% | 5.1% |
| Standard Deviation (Sample) | 3.7% | 7.2% |
| Standard Deviation (Population) | 3.7% | 7.2% |
Similar Demographics by Seniors Poverty Over the Age of 65
Demographics Similar to Egyptians by Seniors Poverty Over the Age of 65
In terms of seniors poverty over the age of 65, the demographic groups most similar to Egyptians are Immigrants from Turkey (10.5%, a difference of 0.010%), Guamanian/Chamorro (10.5%, a difference of 0.050%), Immigrants from Iran (10.4%, a difference of 0.15%), Immigrants from Oceania (10.4%, a difference of 0.15%), and Ottawa (10.4%, a difference of 0.17%).
| Demographics | Rating | Rank | Seniors Poverty Over the Age of 65 |
| Asians | 89.9 /100 | #124 | Excellent 10.4% |
| Immigrants | Philippines | 89.4 /100 | #125 | Excellent 10.4% |
| Immigrants | Hungary | 89.1 /100 | #126 | Excellent 10.4% |
| Cambodians | 89.1 /100 | #127 | Excellent 10.4% |
| Ottawa | 88.5 /100 | #128 | Excellent 10.4% |
| Immigrants | Iran | 88.4 /100 | #129 | Excellent 10.4% |
| Immigrants | Oceania | 88.4 /100 | #130 | Excellent 10.4% |
| Egyptians | 87.8 /100 | #131 | Excellent 10.5% |
| Immigrants | Turkey | 87.7 /100 | #132 | Excellent 10.5% |
| Guamanians/Chamorros | 87.5 /100 | #133 | Excellent 10.5% |
| Sierra Leoneans | 86.8 /100 | #134 | Excellent 10.5% |
| Immigrants | Norway | 86.5 /100 | #135 | Excellent 10.5% |
| Immigrants | Serbia | 86.4 /100 | #136 | Excellent 10.5% |
| Immigrants | Australia | 85.1 /100 | #137 | Excellent 10.5% |
| Immigrants | Latvia | 84.7 /100 | #138 | Excellent 10.5% |
Demographics Similar to Danes by Seniors Poverty Over the Age of 65
In terms of seniors poverty over the age of 65, the demographic groups most similar to Danes are Immigrants from India (8.8%, a difference of 0.45%), Swedish (8.7%, a difference of 0.81%), Norwegian (8.7%, a difference of 1.4%), German (9.0%, a difference of 1.6%), and Czech (9.0%, a difference of 2.1%).
| Demographics | Rating | Rank | Seniors Poverty Over the Age of 65 |
| Chinese | 100.0 /100 | #1 | Exceptional 8.3% |
| Tlingit-Haida | 100.0 /100 | #2 | Exceptional 8.3% |
| Norwegians | 100.0 /100 | #3 | Exceptional 8.7% |
| Swedes | 100.0 /100 | #4 | Exceptional 8.7% |
| Immigrants | India | 100.0 /100 | #5 | Exceptional 8.8% |
| Danes | 100.0 /100 | #6 | Exceptional 8.8% |
| Germans | 100.0 /100 | #7 | Exceptional 9.0% |
| Czechs | 100.0 /100 | #8 | Exceptional 9.0% |
| English | 100.0 /100 | #9 | Exceptional 9.1% |
| Lithuanians | 100.0 /100 | #10 | Exceptional 9.1% |
| Maltese | 99.9 /100 | #11 | Exceptional 9.1% |
| Scandinavians | 99.9 /100 | #12 | Exceptional 9.1% |
| Croatians | 99.9 /100 | #13 | Exceptional 9.1% |
| Poles | 99.9 /100 | #14 | Exceptional 9.1% |
| Dutch | 99.9 /100 | #15 | Exceptional 9.1% |