Mongolian vs Ecuadorian Female Poverty Among 25-34 Year Olds
COMPARE
Mongolian
Ecuadorian
Female Poverty Among 25-34 Year Olds
Female Poverty Among 25-34 Year Olds Comparison
Mongolians
Ecuadorians
12.8%
FEMALE POVERTY AMONG 25-34 YEAR OLDS
93.0/ 100
METRIC RATING
118th/ 347
METRIC RANK
14.3%
FEMALE POVERTY AMONG 25-34 YEAR OLDS
5.2/ 100
METRIC RATING
219th/ 347
METRIC RANK
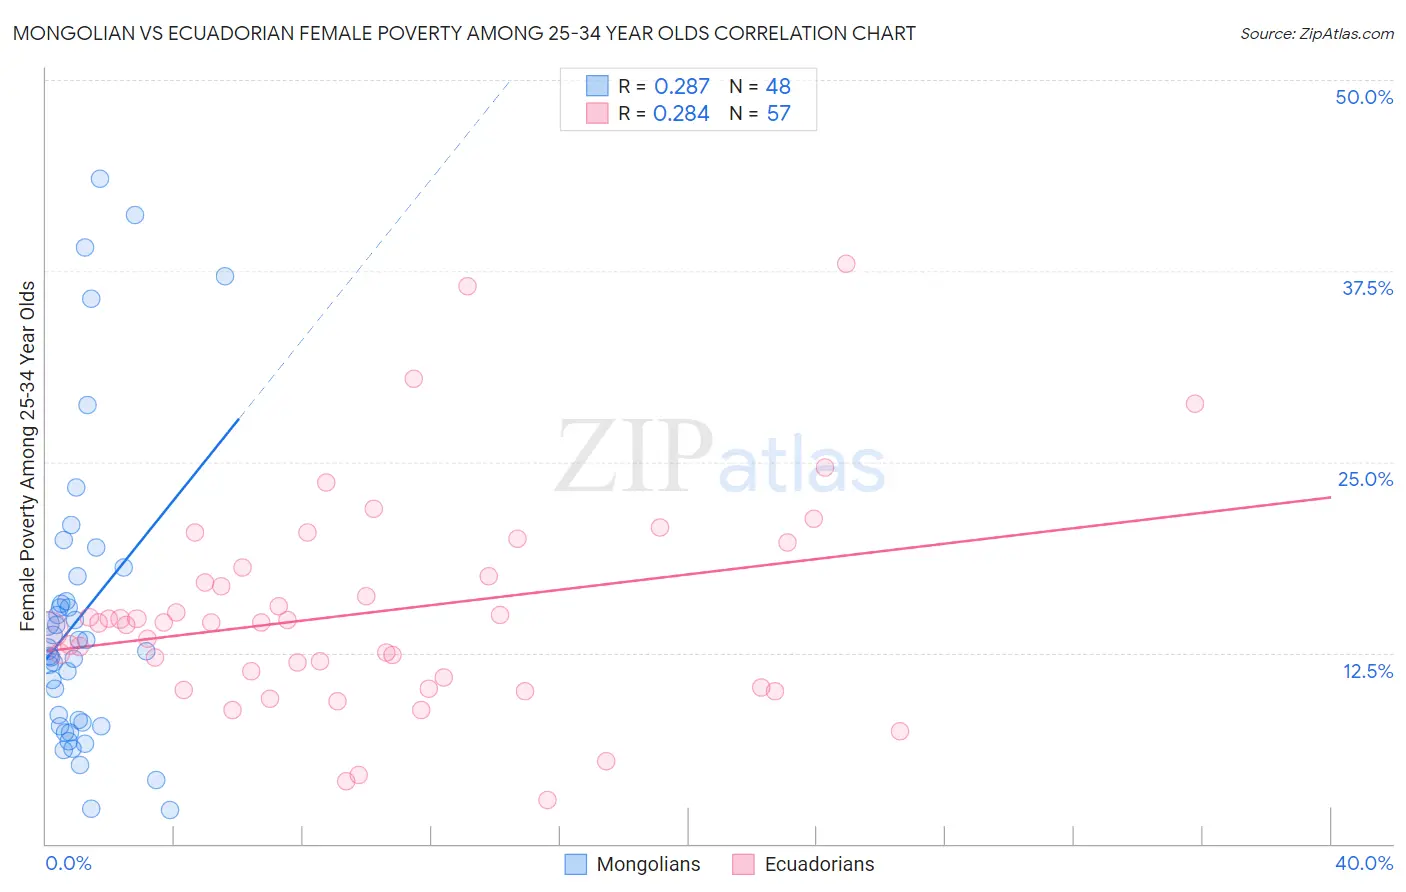
Mongolian vs Ecuadorian Female Poverty Among 25-34 Year Olds Correlation Chart
The statistical analysis conducted on geographies consisting of 139,569,877 people shows a weak positive correlation between the proportion of Mongolians and poverty level among females between the ages 25 and 34 in the United States with a correlation coefficient (R) of 0.287 and weighted average of 12.8%. Similarly, the statistical analysis conducted on geographies consisting of 313,777,043 people shows a weak positive correlation between the proportion of Ecuadorians and poverty level among females between the ages 25 and 34 in the United States with a correlation coefficient (R) of 0.284 and weighted average of 14.3%, a difference of 12.1%.
Female Poverty Among 25-34 Year Olds Correlation Summary
| Measurement | Mongolian | Ecuadorian |
| Minimum | 2.2% | 2.9% |
| Maximum | 43.5% | 38.0% |
| Range | 41.3% | 35.1% |
| Mean | 14.9% | 15.1% |
| Median | 12.7% | 14.5% |
| Interquartile 25% (IQ1) | 7.8% | 10.6% |
| Interquartile 75% (IQ3) | 16.7% | 17.8% |
| Interquartile Range (IQR) | 8.9% | 7.2% |
| Standard Deviation (Sample) | 10.0% | 7.0% |
| Standard Deviation (Population) | 9.9% | 6.9% |
Similar Demographics by Female Poverty Among 25-34 Year Olds
Demographics Similar to Mongolians by Female Poverty Among 25-34 Year Olds
In terms of female poverty among 25-34 year olds, the demographic groups most similar to Mongolians are Immigrants from Kuwait (12.8%, a difference of 0.010%), Immigrants from Nepal (12.8%, a difference of 0.010%), Carpatho Rusyn (12.8%, a difference of 0.010%), Chilean (12.8%, a difference of 0.070%), and Romanian (12.8%, a difference of 0.080%).
| Demographics | Rating | Rank | Female Poverty Among 25-34 Year Olds |
| Danes | 93.9 /100 | #111 | Exceptional 12.8% |
| Immigrants | Morocco | 93.9 /100 | #112 | Exceptional 12.8% |
| Immigrants | Syria | 93.8 /100 | #113 | Exceptional 12.8% |
| Immigrants | Southern Europe | 93.6 /100 | #114 | Exceptional 12.8% |
| Immigrants | Brazil | 93.3 /100 | #115 | Exceptional 12.8% |
| Chileans | 93.2 /100 | #116 | Exceptional 12.8% |
| Immigrants | Kuwait | 93.1 /100 | #117 | Exceptional 12.8% |
| Mongolians | 93.0 /100 | #118 | Exceptional 12.8% |
| Immigrants | Nepal | 93.0 /100 | #119 | Exceptional 12.8% |
| Carpatho Rusyns | 93.0 /100 | #120 | Exceptional 12.8% |
| Romanians | 92.8 /100 | #121 | Exceptional 12.8% |
| Immigrants | Western Asia | 92.7 /100 | #122 | Exceptional 12.8% |
| Slovenes | 92.7 /100 | #123 | Exceptional 12.8% |
| Immigrants | Netherlands | 92.0 /100 | #124 | Exceptional 12.8% |
| Immigrants | Canada | 91.5 /100 | #125 | Exceptional 12.9% |
Demographics Similar to Ecuadorians by Female Poverty Among 25-34 Year Olds
In terms of female poverty among 25-34 year olds, the demographic groups most similar to Ecuadorians are Immigrants from Thailand (14.3%, a difference of 0.0%), Spanish American Indian (14.3%, a difference of 0.11%), French Canadian (14.3%, a difference of 0.12%), Ghanaian (14.4%, a difference of 0.16%), and Sudanese (14.4%, a difference of 0.32%).
| Demographics | Rating | Rank | Female Poverty Among 25-34 Year Olds |
| Immigrants | Guyana | 6.6 /100 | #212 | Tragic 14.3% |
| Puget Sound Salish | 6.5 /100 | #213 | Tragic 14.3% |
| French | 6.2 /100 | #214 | Tragic 14.3% |
| Immigrants | Nigeria | 6.2 /100 | #215 | Tragic 14.3% |
| French Canadians | 5.5 /100 | #216 | Tragic 14.3% |
| Spanish American Indians | 5.5 /100 | #217 | Tragic 14.3% |
| Immigrants | Thailand | 5.2 /100 | #218 | Tragic 14.3% |
| Ecuadorians | 5.2 /100 | #219 | Tragic 14.3% |
| Ghanaians | 4.8 /100 | #220 | Tragic 14.4% |
| Sudanese | 4.4 /100 | #221 | Tragic 14.4% |
| Immigrants | Portugal | 4.3 /100 | #222 | Tragic 14.4% |
| Nigerians | 4.2 /100 | #223 | Tragic 14.4% |
| Immigrants | Sudan | 4.0 /100 | #224 | Tragic 14.4% |
| Immigrants | Barbados | 3.4 /100 | #225 | Tragic 14.5% |
| Nicaraguans | 3.3 /100 | #226 | Tragic 14.5% |