Dutch West Indian vs French Canadian Male Poverty
COMPARE
Dutch West Indian
French Canadian
Male Poverty
Male Poverty Comparison
Dutch West Indians
French Canadians
14.2%
MALE POVERTY
0.0/ 100
METRIC RATING
307th/ 347
METRIC RANK
10.5%
MALE POVERTY
91.9/ 100
METRIC RATING
102nd/ 347
METRIC RANK
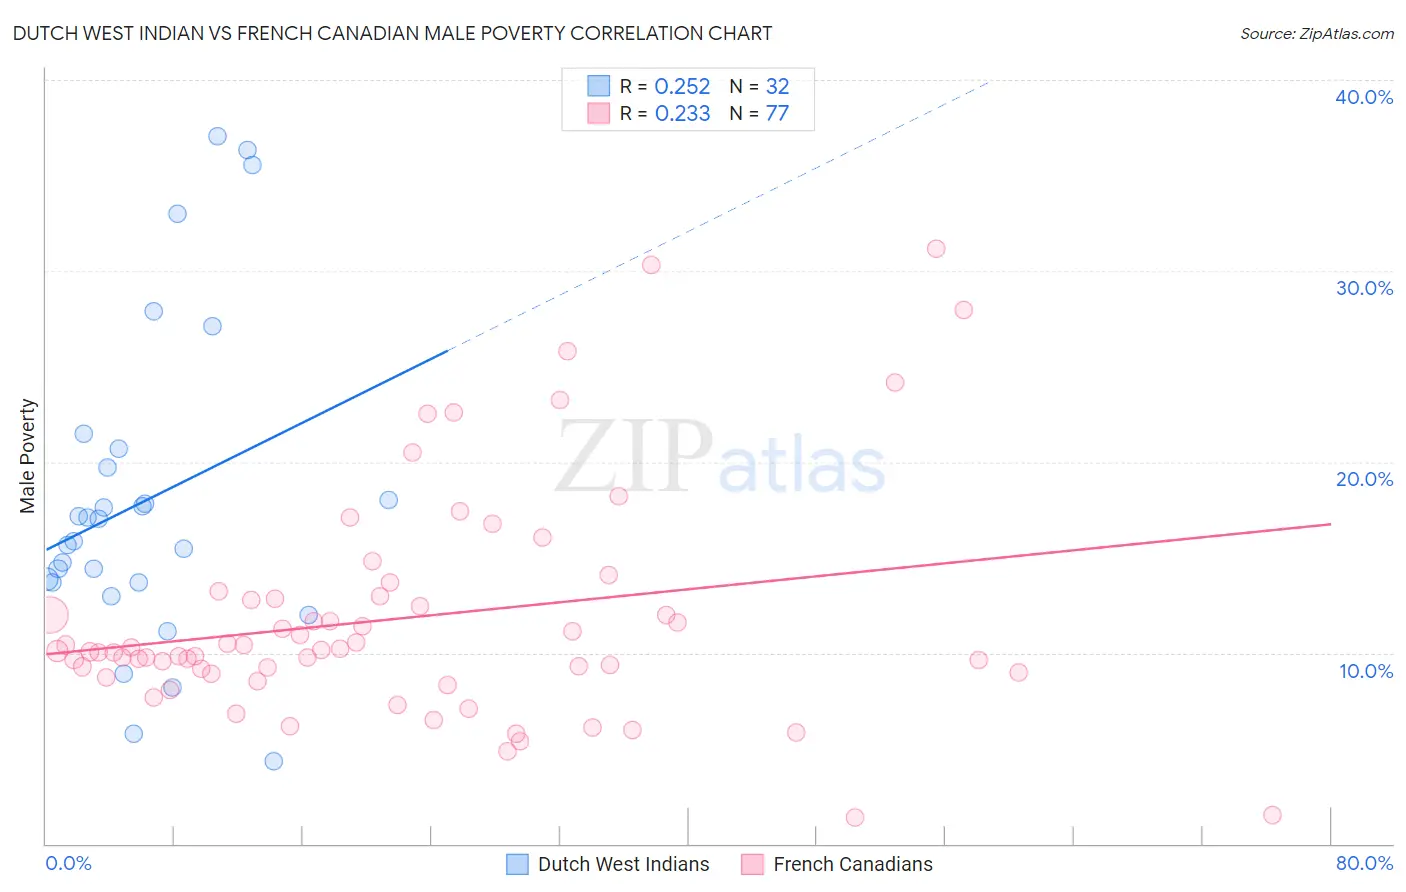
Dutch West Indian vs French Canadian Male Poverty Correlation Chart
The statistical analysis conducted on geographies consisting of 85,761,209 people shows a weak positive correlation between the proportion of Dutch West Indians and poverty level among males in the United States with a correlation coefficient (R) of 0.252 and weighted average of 14.2%. Similarly, the statistical analysis conducted on geographies consisting of 501,843,843 people shows a weak positive correlation between the proportion of French Canadians and poverty level among males in the United States with a correlation coefficient (R) of 0.233 and weighted average of 10.5%, a difference of 35.0%.
Male Poverty Correlation Summary
| Measurement | Dutch West Indian | French Canadian |
| Minimum | 4.3% | 1.4% |
| Maximum | 37.0% | 31.1% |
| Range | 32.7% | 29.8% |
| Mean | 18.0% | 11.8% |
| Median | 16.4% | 10.1% |
| Interquartile 25% (IQ1) | 13.7% | 8.9% |
| Interquartile 75% (IQ3) | 20.2% | 12.9% |
| Interquartile Range (IQR) | 6.5% | 4.0% |
| Standard Deviation (Sample) | 8.4% | 5.9% |
| Standard Deviation (Population) | 8.2% | 5.9% |
Similar Demographics by Male Poverty
Demographics Similar to Dutch West Indians by Male Poverty
In terms of male poverty, the demographic groups most similar to Dutch West Indians are African (14.2%, a difference of 0.020%), Somali (14.3%, a difference of 0.40%), Seminole (14.3%, a difference of 0.60%), Creek (14.1%, a difference of 0.70%), and Immigrants from Bangladesh (14.1%, a difference of 0.77%).
| Demographics | Rating | Rank | Male Poverty |
| Immigrants | Mexico | 0.0 /100 | #300 | Tragic 14.0% |
| Immigrants | Senegal | 0.0 /100 | #301 | Tragic 14.0% |
| Immigrants | Caribbean | 0.0 /100 | #302 | Tragic 14.0% |
| Bahamians | 0.0 /100 | #303 | Tragic 14.1% |
| Senegalese | 0.0 /100 | #304 | Tragic 14.1% |
| Immigrants | Bangladesh | 0.0 /100 | #305 | Tragic 14.1% |
| Creek | 0.0 /100 | #306 | Tragic 14.1% |
| Dutch West Indians | 0.0 /100 | #307 | Tragic 14.2% |
| Africans | 0.0 /100 | #308 | Tragic 14.2% |
| Somalis | 0.0 /100 | #309 | Tragic 14.3% |
| Seminole | 0.0 /100 | #310 | Tragic 14.3% |
| Hondurans | 0.0 /100 | #311 | Tragic 14.3% |
| Choctaw | 0.0 /100 | #312 | Tragic 14.4% |
| Immigrants | Somalia | 0.0 /100 | #313 | Tragic 14.6% |
| Immigrants | Honduras | 0.0 /100 | #314 | Tragic 14.6% |
Demographics Similar to French Canadians by Male Poverty
In terms of male poverty, the demographic groups most similar to French Canadians are Immigrants from Zimbabwe (10.5%, a difference of 0.010%), Slavic (10.5%, a difference of 0.10%), Welsh (10.5%, a difference of 0.11%), Canadian (10.5%, a difference of 0.12%), and Immigrants from Southern Europe (10.5%, a difference of 0.23%).
| Demographics | Rating | Rank | Male Poverty |
| Scottish | 94.0 /100 | #95 | Exceptional 10.4% |
| Immigrants | Egypt | 93.7 /100 | #96 | Exceptional 10.4% |
| Romanians | 93.6 /100 | #97 | Exceptional 10.5% |
| Finns | 93.4 /100 | #98 | Exceptional 10.5% |
| Immigrants | Indonesia | 93.3 /100 | #99 | Exceptional 10.5% |
| Immigrants | Latvia | 92.8 /100 | #100 | Exceptional 10.5% |
| Immigrants | Zimbabwe | 92.0 /100 | #101 | Exceptional 10.5% |
| French Canadians | 91.9 /100 | #102 | Exceptional 10.5% |
| Slavs | 91.7 /100 | #103 | Exceptional 10.5% |
| Welsh | 91.6 /100 | #104 | Exceptional 10.5% |
| Canadians | 91.6 /100 | #105 | Exceptional 10.5% |
| Immigrants | Southern Europe | 91.3 /100 | #106 | Exceptional 10.5% |
| Laotians | 91.2 /100 | #107 | Exceptional 10.5% |
| Portuguese | 91.0 /100 | #108 | Exceptional 10.6% |
| Albanians | 90.6 /100 | #109 | Exceptional 10.6% |