Dutch West Indian vs Iranian Male Poverty
COMPARE
Dutch West Indian
Iranian
Male Poverty
Male Poverty Comparison
Dutch West Indians
Iranians
14.2%
MALE POVERTY
0.0/ 100
METRIC RATING
307th/ 347
METRIC RANK
9.8%
MALE POVERTY
99.4/ 100
METRIC RATING
35th/ 347
METRIC RANK
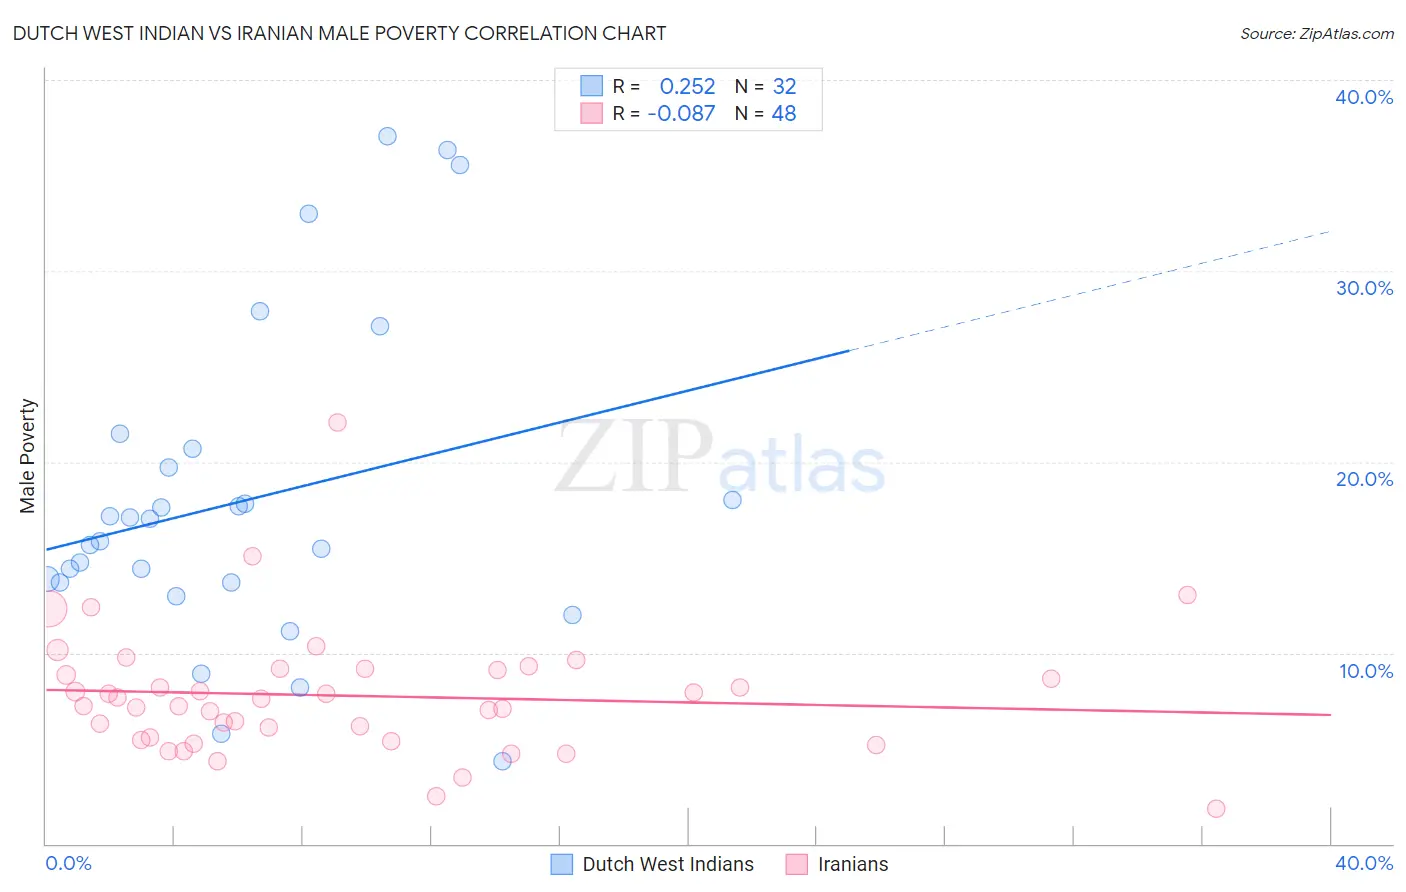
Dutch West Indian vs Iranian Male Poverty Correlation Chart
The statistical analysis conducted on geographies consisting of 85,761,209 people shows a weak positive correlation between the proportion of Dutch West Indians and poverty level among males in the United States with a correlation coefficient (R) of 0.252 and weighted average of 14.2%. Similarly, the statistical analysis conducted on geographies consisting of 316,583,039 people shows a slight negative correlation between the proportion of Iranians and poverty level among males in the United States with a correlation coefficient (R) of -0.087 and weighted average of 9.8%, a difference of 45.1%.
Male Poverty Correlation Summary
| Measurement | Dutch West Indian | Iranian |
| Minimum | 4.3% | 1.8% |
| Maximum | 37.0% | 22.1% |
| Range | 32.7% | 20.3% |
| Mean | 18.0% | 7.8% |
| Median | 16.4% | 7.4% |
| Interquartile 25% (IQ1) | 13.7% | 5.5% |
| Interquartile 75% (IQ3) | 20.2% | 9.1% |
| Interquartile Range (IQR) | 6.5% | 3.6% |
| Standard Deviation (Sample) | 8.4% | 3.4% |
| Standard Deviation (Population) | 8.2% | 3.3% |
Similar Demographics by Male Poverty
Demographics Similar to Dutch West Indians by Male Poverty
In terms of male poverty, the demographic groups most similar to Dutch West Indians are African (14.2%, a difference of 0.020%), Somali (14.3%, a difference of 0.40%), Seminole (14.3%, a difference of 0.60%), Creek (14.1%, a difference of 0.70%), and Immigrants from Bangladesh (14.1%, a difference of 0.77%).
| Demographics | Rating | Rank | Male Poverty |
| Immigrants | Mexico | 0.0 /100 | #300 | Tragic 14.0% |
| Immigrants | Senegal | 0.0 /100 | #301 | Tragic 14.0% |
| Immigrants | Caribbean | 0.0 /100 | #302 | Tragic 14.0% |
| Bahamians | 0.0 /100 | #303 | Tragic 14.1% |
| Senegalese | 0.0 /100 | #304 | Tragic 14.1% |
| Immigrants | Bangladesh | 0.0 /100 | #305 | Tragic 14.1% |
| Creek | 0.0 /100 | #306 | Tragic 14.1% |
| Dutch West Indians | 0.0 /100 | #307 | Tragic 14.2% |
| Africans | 0.0 /100 | #308 | Tragic 14.2% |
| Somalis | 0.0 /100 | #309 | Tragic 14.3% |
| Seminole | 0.0 /100 | #310 | Tragic 14.3% |
| Hondurans | 0.0 /100 | #311 | Tragic 14.3% |
| Choctaw | 0.0 /100 | #312 | Tragic 14.4% |
| Immigrants | Somalia | 0.0 /100 | #313 | Tragic 14.6% |
| Immigrants | Honduras | 0.0 /100 | #314 | Tragic 14.6% |
Demographics Similar to Iranians by Male Poverty
In terms of male poverty, the demographic groups most similar to Iranians are Czech (9.8%, a difference of 0.090%), Immigrants from Poland (9.8%, a difference of 0.30%), Immigrants from Greece (9.8%, a difference of 0.31%), Immigrants from Northern Europe (9.7%, a difference of 0.45%), and Macedonian (9.7%, a difference of 0.54%).
| Demographics | Rating | Rank | Male Poverty |
| Immigrants | Korea | 99.6 /100 | #28 | Exceptional 9.7% |
| Greeks | 99.6 /100 | #29 | Exceptional 9.7% |
| Poles | 99.5 /100 | #30 | Exceptional 9.7% |
| Tongans | 99.5 /100 | #31 | Exceptional 9.7% |
| Macedonians | 99.5 /100 | #32 | Exceptional 9.7% |
| Immigrants | Northern Europe | 99.5 /100 | #33 | Exceptional 9.7% |
| Immigrants | Poland | 99.5 /100 | #34 | Exceptional 9.8% |
| Iranians | 99.4 /100 | #35 | Exceptional 9.8% |
| Czechs | 99.4 /100 | #36 | Exceptional 9.8% |
| Immigrants | Greece | 99.3 /100 | #37 | Exceptional 9.8% |
| Immigrants | Pakistan | 99.2 /100 | #38 | Exceptional 9.9% |
| Russians | 99.2 /100 | #39 | Exceptional 9.9% |
| Cypriots | 99.2 /100 | #40 | Exceptional 9.9% |
| Koreans | 99.2 /100 | #41 | Exceptional 9.9% |
| Immigrants | Iran | 99.1 /100 | #42 | Exceptional 9.9% |