Dutch West Indian vs English Child Poverty Among Girls Under 16
COMPARE
Dutch West Indian
English
Child Poverty Among Girls Under 16
Child Poverty Among Girls Under 16 Comparison
Dutch West Indians
English
21.6%
CHILD POVERTY AMONG GIRLS UNDER 16
0.0/ 100
METRIC RATING
311th/ 347
METRIC RANK
15.3%
CHILD POVERTY AMONG GIRLS UNDER 16
92.2/ 100
METRIC RATING
121st/ 347
METRIC RANK
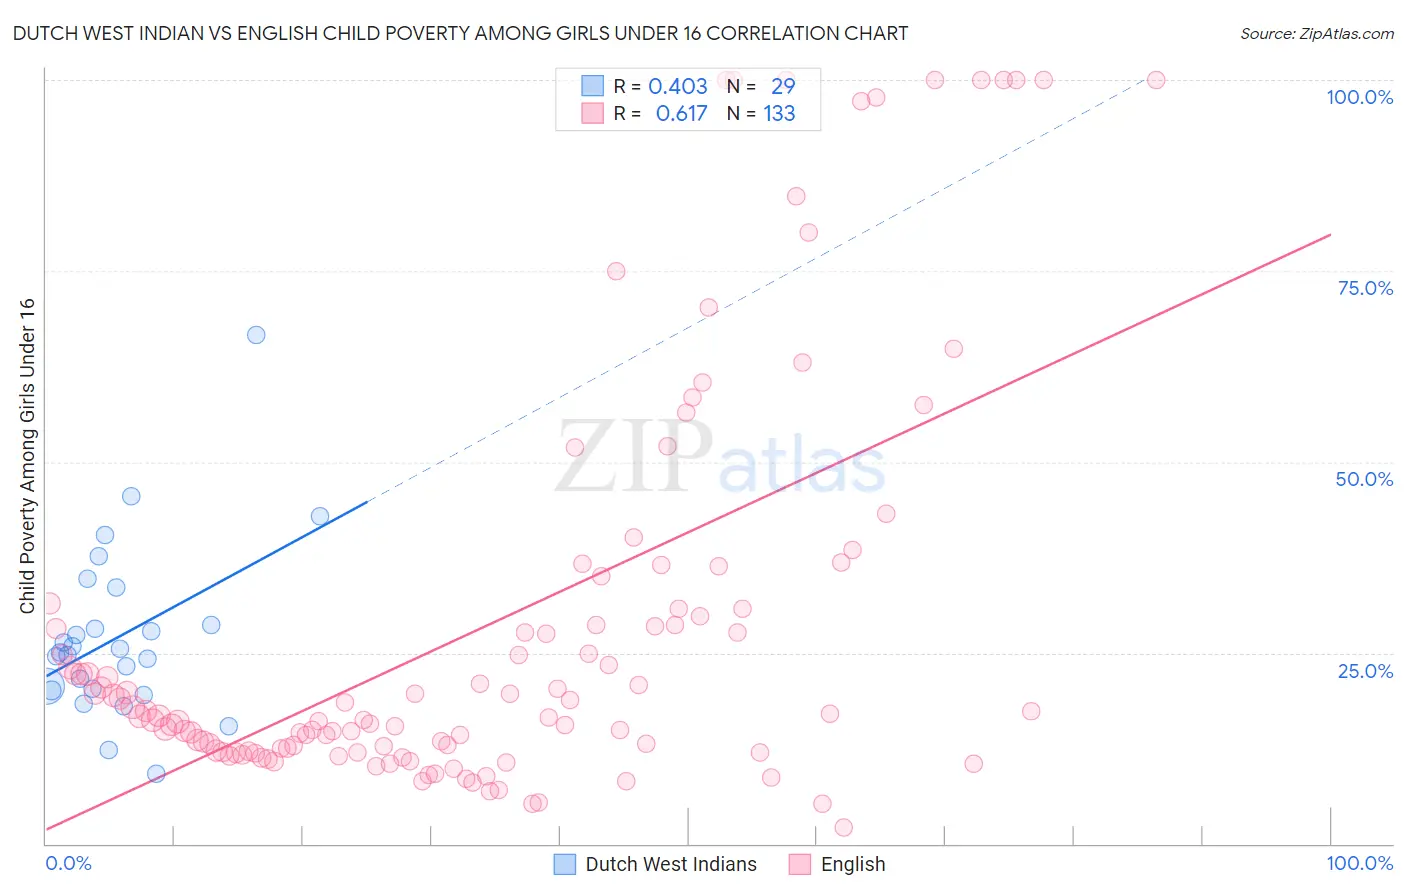
Dutch West Indian vs English Child Poverty Among Girls Under 16 Correlation Chart
The statistical analysis conducted on geographies consisting of 85,504,644 people shows a moderate positive correlation between the proportion of Dutch West Indians and poverty level among girls under the age of 16 in the United States with a correlation coefficient (R) of 0.403 and weighted average of 21.6%. Similarly, the statistical analysis conducted on geographies consisting of 554,761,562 people shows a significant positive correlation between the proportion of English and poverty level among girls under the age of 16 in the United States with a correlation coefficient (R) of 0.617 and weighted average of 15.3%, a difference of 41.0%.
Child Poverty Among Girls Under 16 Correlation Summary
| Measurement | Dutch West Indian | English |
| Minimum | 9.2% | 2.2% |
| Maximum | 66.7% | 100.0% |
| Range | 57.4% | 97.8% |
| Mean | 27.2% | 28.6% |
| Median | 25.0% | 17.0% |
| Interquartile 25% (IQ1) | 20.2% | 12.1% |
| Interquartile 75% (IQ3) | 31.0% | 30.8% |
| Interquartile Range (IQR) | 10.8% | 18.6% |
| Standard Deviation (Sample) | 11.4% | 26.6% |
| Standard Deviation (Population) | 11.2% | 26.5% |
Similar Demographics by Child Poverty Among Girls Under 16
Demographics Similar to Dutch West Indians by Child Poverty Among Girls Under 16
In terms of child poverty among girls under 16, the demographic groups most similar to Dutch West Indians are Immigrants from Somalia (21.6%, a difference of 0.060%), Immigrants from Mexico (21.6%, a difference of 0.23%), Bahamian (21.5%, a difference of 0.33%), Houma (21.5%, a difference of 0.46%), and Immigrants from Bahamas (21.4%, a difference of 0.63%).
| Demographics | Rating | Rank | Child Poverty Among Girls Under 16 |
| Indonesians | 0.0 /100 | #304 | Tragic 21.3% |
| Guatemalans | 0.0 /100 | #305 | Tragic 21.4% |
| Immigrants | Central America | 0.0 /100 | #306 | Tragic 21.4% |
| Immigrants | Bahamas | 0.0 /100 | #307 | Tragic 21.4% |
| Houma | 0.0 /100 | #308 | Tragic 21.5% |
| Bahamians | 0.0 /100 | #309 | Tragic 21.5% |
| Immigrants | Somalia | 0.0 /100 | #310 | Tragic 21.6% |
| Dutch West Indians | 0.0 /100 | #311 | Tragic 21.6% |
| Immigrants | Mexico | 0.0 /100 | #312 | Tragic 21.6% |
| Creek | 0.0 /100 | #313 | Tragic 21.7% |
| Arapaho | 0.0 /100 | #314 | Tragic 21.7% |
| Ute | 0.0 /100 | #315 | Tragic 21.8% |
| Immigrants | Guatemala | 0.0 /100 | #316 | Tragic 21.9% |
| Africans | 0.0 /100 | #317 | Tragic 21.9% |
| Immigrants | Dominica | 0.0 /100 | #318 | Tragic 22.1% |
Demographics Similar to English by Child Poverty Among Girls Under 16
In terms of child poverty among girls under 16, the demographic groups most similar to English are Pakistani (15.3%, a difference of 0.020%), Immigrants from Zimbabwe (15.3%, a difference of 0.11%), Portuguese (15.3%, a difference of 0.19%), Immigrants from Southern Europe (15.3%, a difference of 0.22%), and Irish (15.3%, a difference of 0.28%).
| Demographics | Rating | Rank | Child Poverty Among Girls Under 16 |
| Sri Lankans | 94.0 /100 | #114 | Exceptional 15.2% |
| Belgians | 93.9 /100 | #115 | Exceptional 15.2% |
| Immigrants | Denmark | 93.3 /100 | #116 | Exceptional 15.2% |
| Immigrants | North Macedonia | 93.1 /100 | #117 | Exceptional 15.2% |
| Immigrants | Southern Europe | 92.7 /100 | #118 | Exceptional 15.3% |
| Immigrants | Zimbabwe | 92.5 /100 | #119 | Exceptional 15.3% |
| Pakistanis | 92.3 /100 | #120 | Exceptional 15.3% |
| English | 92.2 /100 | #121 | Exceptional 15.3% |
| Portuguese | 91.8 /100 | #122 | Exceptional 15.3% |
| Irish | 91.5 /100 | #123 | Exceptional 15.3% |
| Carpatho Rusyns | 91.4 /100 | #124 | Exceptional 15.3% |
| Peruvians | 91.2 /100 | #125 | Exceptional 15.4% |
| Scottish | 91.0 /100 | #126 | Exceptional 15.4% |
| Immigrants | Norway | 90.8 /100 | #127 | Exceptional 15.4% |
| Albanians | 90.5 /100 | #128 | Exceptional 15.4% |