Immigrants from Sweden vs Iroquois Seniors Poverty Over the Age of 75
COMPARE
Immigrants from Sweden
Iroquois
Seniors Poverty Over the Age of 75
Seniors Poverty Over the Age of 75 Comparison
Immigrants from Sweden
Iroquois
11.6%
SENIORS POVERTY OVER THE AGE OF 75
92.6/ 100
METRIC RATING
96th/ 347
METRIC RANK
14.0%
SENIORS POVERTY OVER THE AGE OF 75
0.1/ 100
METRIC RATING
263rd/ 347
METRIC RANK
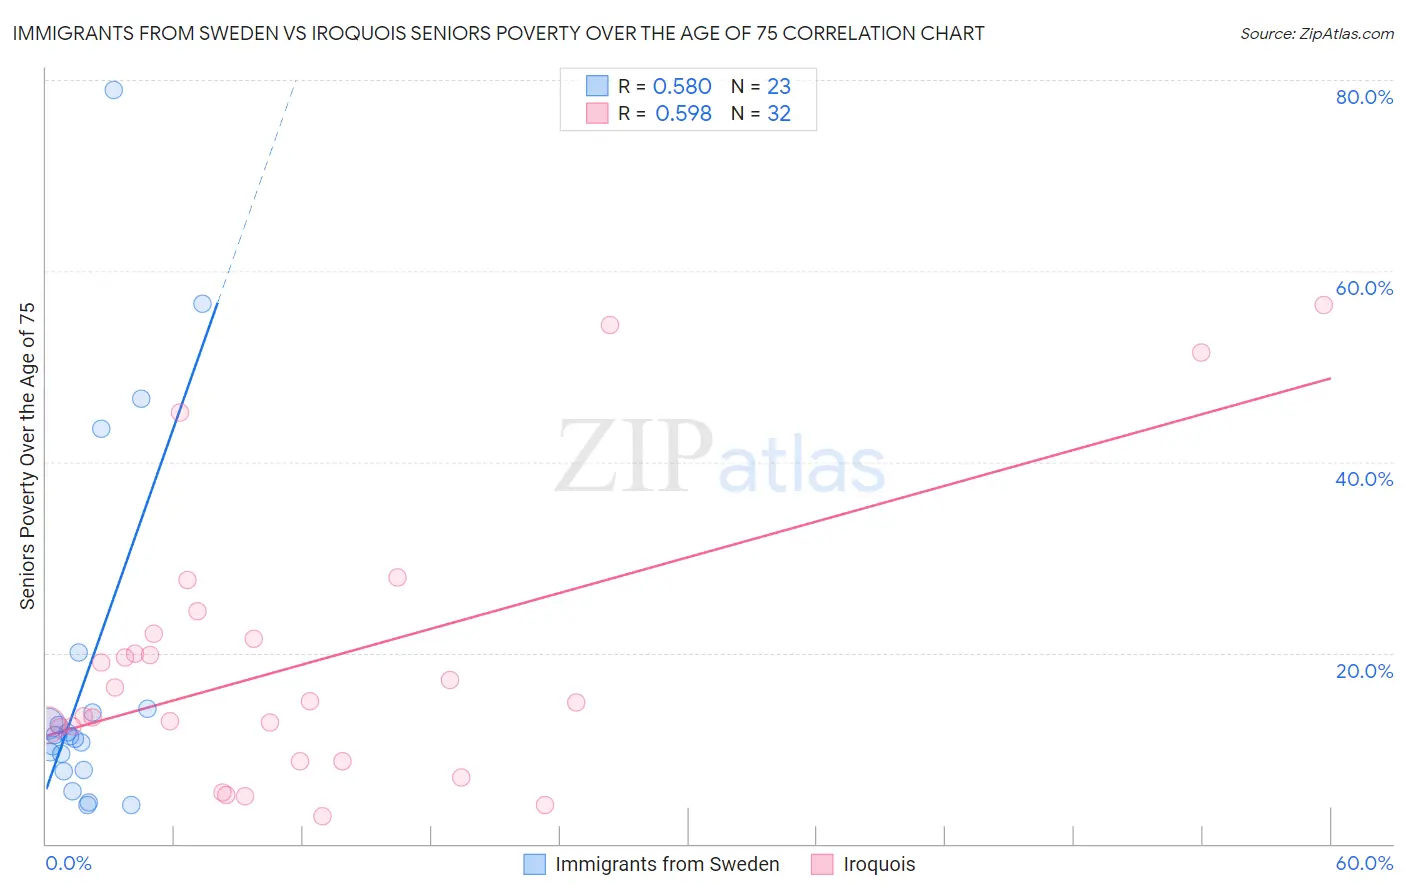
Immigrants from Sweden vs Iroquois Seniors Poverty Over the Age of 75 Correlation Chart
The statistical analysis conducted on geographies consisting of 163,927,816 people shows a substantial positive correlation between the proportion of Immigrants from Sweden and poverty level among seniors over the age of 75 in the United States with a correlation coefficient (R) of 0.580 and weighted average of 11.6%. Similarly, the statistical analysis conducted on geographies consisting of 205,964,404 people shows a substantial positive correlation between the proportion of Iroquois and poverty level among seniors over the age of 75 in the United States with a correlation coefficient (R) of 0.598 and weighted average of 14.0%, a difference of 21.1%.
Seniors Poverty Over the Age of 75 Correlation Summary
| Measurement | Immigrants from Sweden | Iroquois |
| Minimum | 4.0% | 2.9% |
| Maximum | 78.9% | 56.5% |
| Range | 74.9% | 53.5% |
| Mean | 18.1% | 19.0% |
| Median | 11.3% | 14.9% |
| Interquartile 25% (IQ1) | 7.7% | 10.4% |
| Interquartile 75% (IQ3) | 14.1% | 21.7% |
| Interquartile Range (IQR) | 6.3% | 11.3% |
| Standard Deviation (Sample) | 19.2% | 14.3% |
| Standard Deviation (Population) | 18.8% | 14.1% |
Similar Demographics by Seniors Poverty Over the Age of 75
Demographics Similar to Immigrants from Sweden by Seniors Poverty Over the Age of 75
In terms of seniors poverty over the age of 75, the demographic groups most similar to Immigrants from Sweden are Immigrants from Bosnia and Herzegovina (11.6%, a difference of 0.0%), Creek (11.6%, a difference of 0.040%), Romanian (11.6%, a difference of 0.080%), Immigrants from Poland (11.6%, a difference of 0.090%), and Immigrants from Japan (11.6%, a difference of 0.20%).
| Demographics | Rating | Rank | Seniors Poverty Over the Age of 75 |
| Immigrants | Sri Lanka | 94.4 /100 | #89 | Exceptional 11.5% |
| Aleuts | 94.1 /100 | #90 | Exceptional 11.5% |
| Immigrants | Germany | 94.1 /100 | #91 | Exceptional 11.5% |
| Kenyans | 93.9 /100 | #92 | Exceptional 11.5% |
| Immigrants | Poland | 92.9 /100 | #93 | Exceptional 11.6% |
| Creek | 92.7 /100 | #94 | Exceptional 11.6% |
| Immigrants | Bosnia and Herzegovina | 92.6 /100 | #95 | Exceptional 11.6% |
| Immigrants | Sweden | 92.6 /100 | #96 | Exceptional 11.6% |
| Romanians | 92.3 /100 | #97 | Exceptional 11.6% |
| Immigrants | Japan | 91.9 /100 | #98 | Exceptional 11.6% |
| Immigrants | Ethiopia | 91.7 /100 | #99 | Exceptional 11.6% |
| Syrians | 91.1 /100 | #100 | Exceptional 11.6% |
| Jordanians | 90.8 /100 | #101 | Exceptional 11.6% |
| Guamanians/Chamorros | 90.6 /100 | #102 | Exceptional 11.6% |
| Immigrants | Kuwait | 90.5 /100 | #103 | Exceptional 11.6% |
Demographics Similar to Iroquois by Seniors Poverty Over the Age of 75
In terms of seniors poverty over the age of 75, the demographic groups most similar to Iroquois are Cajun (14.0%, a difference of 0.13%), Ghanaian (14.0%, a difference of 0.36%), Immigrants (13.9%, a difference of 0.46%), Immigrants from Portugal (13.9%, a difference of 0.53%), and Immigrants from Panama (13.9%, a difference of 0.57%).
| Demographics | Rating | Rank | Seniors Poverty Over the Age of 75 |
| Inupiat | 0.1 /100 | #256 | Tragic 13.8% |
| Immigrants | Western Africa | 0.1 /100 | #257 | Tragic 13.9% |
| Immigrants | Panama | 0.1 /100 | #258 | Tragic 13.9% |
| Immigrants | Portugal | 0.1 /100 | #259 | Tragic 13.9% |
| Immigrants | Immigrants | 0.1 /100 | #260 | Tragic 13.9% |
| Ghanaians | 0.1 /100 | #261 | Tragic 14.0% |
| Cajuns | 0.1 /100 | #262 | Tragic 14.0% |
| Iroquois | 0.1 /100 | #263 | Tragic 14.0% |
| South Americans | 0.0 /100 | #264 | Tragic 14.1% |
| Salvadorans | 0.0 /100 | #265 | Tragic 14.2% |
| Armenians | 0.0 /100 | #266 | Tragic 14.2% |
| Venezuelans | 0.0 /100 | #267 | Tragic 14.2% |
| Colombians | 0.0 /100 | #268 | Tragic 14.3% |
| Immigrants | Venezuela | 0.0 /100 | #269 | Tragic 14.3% |
| Immigrants | Uruguay | 0.0 /100 | #270 | Tragic 14.3% |