Delaware vs Belizean Seniors Poverty Over the Age of 75
COMPARE
Delaware
Belizean
Seniors Poverty Over the Age of 75
Seniors Poverty Over the Age of 75 Comparison
Delaware
Belizeans
11.4%
SENIORS POVERTY OVER THE AGE OF 75
96.0/ 100
METRIC RATING
74th/ 347
METRIC RANK
14.8%
SENIORS POVERTY OVER THE AGE OF 75
0.0/ 100
METRIC RATING
281st/ 347
METRIC RANK
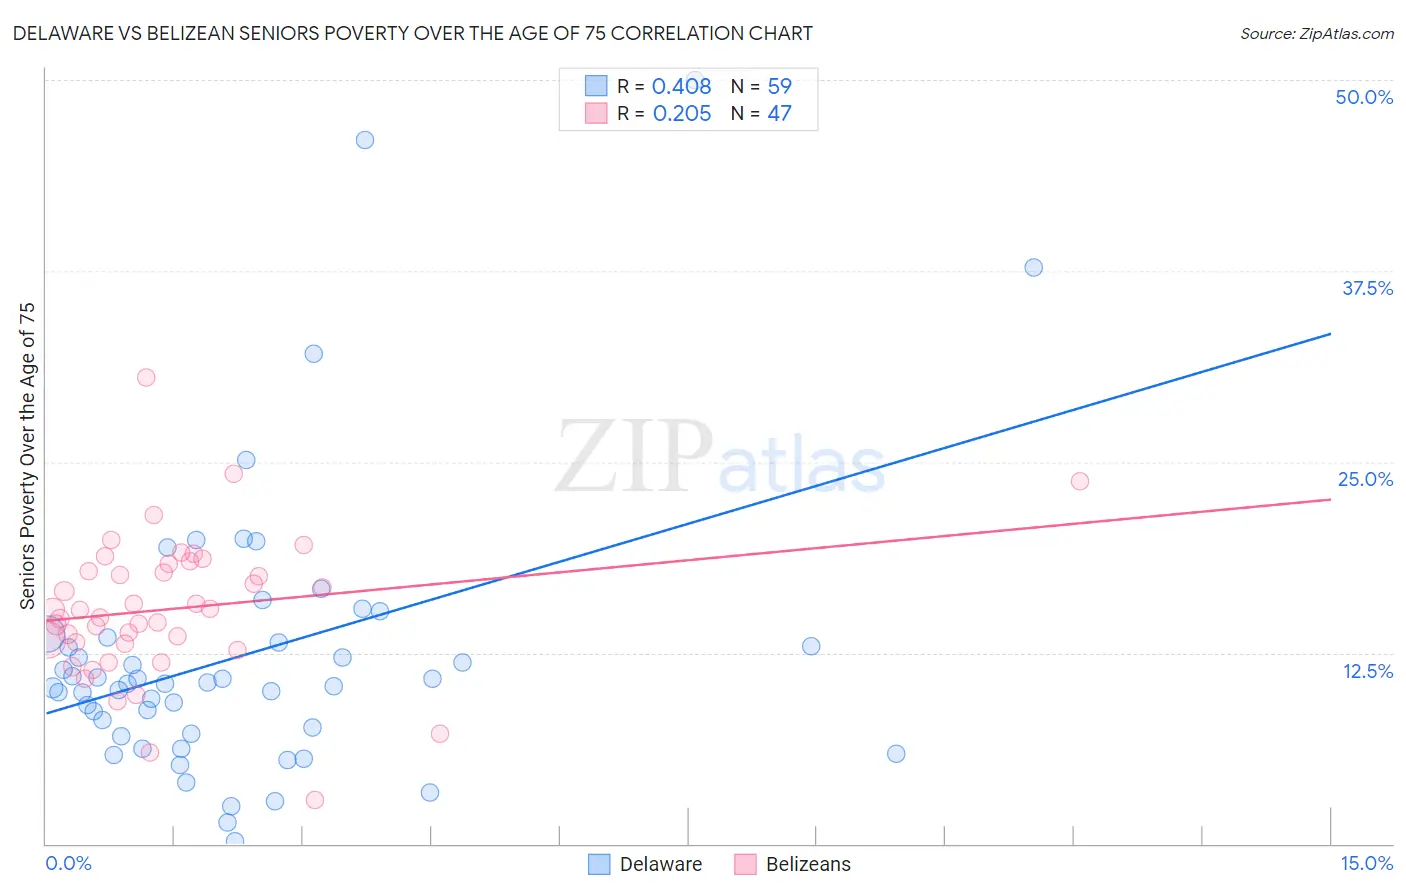
Delaware vs Belizean Seniors Poverty Over the Age of 75 Correlation Chart
The statistical analysis conducted on geographies consisting of 95,641,420 people shows a moderate positive correlation between the proportion of Delaware and poverty level among seniors over the age of 75 in the United States with a correlation coefficient (R) of 0.408 and weighted average of 11.4%. Similarly, the statistical analysis conducted on geographies consisting of 143,767,946 people shows a weak positive correlation between the proportion of Belizeans and poverty level among seniors over the age of 75 in the United States with a correlation coefficient (R) of 0.205 and weighted average of 14.8%, a difference of 29.4%.
Seniors Poverty Over the Age of 75 Correlation Summary
| Measurement | Delaware | Belizean |
| Minimum | 0.12% | 2.8% |
| Maximum | 50.0% | 30.5% |
| Range | 49.9% | 27.7% |
| Mean | 12.5% | 15.4% |
| Median | 10.5% | 15.3% |
| Interquartile 25% (IQ1) | 7.2% | 13.1% |
| Interquartile 75% (IQ3) | 13.5% | 18.4% |
| Interquartile Range (IQR) | 6.2% | 5.2% |
| Standard Deviation (Sample) | 9.4% | 4.8% |
| Standard Deviation (Population) | 9.3% | 4.7% |
Similar Demographics by Seniors Poverty Over the Age of 75
Demographics Similar to Delaware by Seniors Poverty Over the Age of 75
In terms of seniors poverty over the age of 75, the demographic groups most similar to Delaware are Immigrants from Micronesia (11.4%, a difference of 0.010%), Sierra Leonean (11.4%, a difference of 0.10%), Palestinian (11.4%, a difference of 0.10%), French Canadian (11.4%, a difference of 0.16%), and Osage (11.4%, a difference of 0.20%).
| Demographics | Rating | Rank | Seniors Poverty Over the Age of 75 |
| Bolivians | 96.5 /100 | #67 | Exceptional 11.4% |
| Immigrants | Austria | 96.5 /100 | #68 | Exceptional 11.4% |
| Ottawa | 96.5 /100 | #69 | Exceptional 11.4% |
| Immigrants | South Central Asia | 96.4 /100 | #70 | Exceptional 11.4% |
| Osage | 96.3 /100 | #71 | Exceptional 11.4% |
| Sierra Leoneans | 96.1 /100 | #72 | Exceptional 11.4% |
| Immigrants | Micronesia | 96.0 /100 | #73 | Exceptional 11.4% |
| Delaware | 96.0 /100 | #74 | Exceptional 11.4% |
| Palestinians | 95.8 /100 | #75 | Exceptional 11.4% |
| French Canadians | 95.7 /100 | #76 | Exceptional 11.4% |
| Whites/Caucasians | 95.5 /100 | #77 | Exceptional 11.4% |
| Macedonians | 95.5 /100 | #78 | Exceptional 11.4% |
| Filipinos | 95.5 /100 | #79 | Exceptional 11.4% |
| Alaska Natives | 95.4 /100 | #80 | Exceptional 11.4% |
| Basques | 95.1 /100 | #81 | Exceptional 11.5% |
Demographics Similar to Belizeans by Seniors Poverty Over the Age of 75
In terms of seniors poverty over the age of 75, the demographic groups most similar to Belizeans are Central American (14.7%, a difference of 0.12%), Immigrants from Senegal (14.8%, a difference of 0.18%), Guatemalan (14.8%, a difference of 0.24%), Black/African American (14.6%, a difference of 0.76%), and Cheyenne (14.9%, a difference of 0.88%).
| Demographics | Rating | Rank | Seniors Poverty Over the Age of 75 |
| Immigrants | Bahamas | 0.0 /100 | #274 | Tragic 14.4% |
| Immigrants | El Salvador | 0.0 /100 | #275 | Tragic 14.5% |
| Soviet Union | 0.0 /100 | #276 | Tragic 14.5% |
| Senegalese | 0.0 /100 | #277 | Tragic 14.5% |
| Immigrants | Colombia | 0.0 /100 | #278 | Tragic 14.6% |
| Blacks/African Americans | 0.0 /100 | #279 | Tragic 14.6% |
| Central Americans | 0.0 /100 | #280 | Tragic 14.7% |
| Belizeans | 0.0 /100 | #281 | Tragic 14.8% |
| Immigrants | Senegal | 0.0 /100 | #282 | Tragic 14.8% |
| Guatemalans | 0.0 /100 | #283 | Tragic 14.8% |
| Cheyenne | 0.0 /100 | #284 | Tragic 14.9% |
| Immigrants | Mexico | 0.0 /100 | #285 | Tragic 14.9% |
| Immigrants | Central America | 0.0 /100 | #286 | Tragic 15.0% |
| Immigrants | Guatemala | 0.0 /100 | #287 | Tragic 15.1% |
| Jamaicans | 0.0 /100 | #288 | Tragic 15.1% |