Delaware vs Immigrants from Southern Europe Seniors Poverty Over the Age of 75

COMPARE

Delaware
Race
Ancestry
AfghanAfricanAlaska NativeAlaskan AthabascanAlbanianAleutAlsatianAmericanApacheArabArapahoArgentineanArmenianAssyrian/Chaldean/SyriacAustralianAustrianBahamianBangladeshiBarbadianBasqueBelgianBelizeanBermudanBhutaneseBlackfeetBolivianBrazilianBritishBritish West IndianBulgarianBurmeseCajunCambodianCanadianCape VerdeanCarpatho RusynCelticCentral AmericanCentral American IndianCherokeeCheyenneChickasawChileanChineseChippewaChoctawColombianColvilleComancheCosta RicanCreeCreekCroatianCrowCubanCypriotCzechCzechoslovakianDanishDelawareDominicanDutchDutch West IndianEastern EuropeanEcuadorianEgyptianEnglishEstonianEthiopianEuropeanFijianFilipinoFinnishFrenchFrench American IndianFrench CanadianGermanGerman RussianGhanaianGreekGuamanian/ChamorroGuatemalanGuyaneseHaitianHmongHonduranHopiHoumaHungarianIcelanderIndian (Asian)IndonesianInupiatIranianIraqiIrishIroquoisIsraeliItalianJamaicanJapaneseJordanianKenyanKiowaKoreanLaotianLatvianLebaneseLiberianLithuanianLumbeeLuxembourgerMacedonianMalaysianMalteseMarshalleseMenomineeMexicanMexican American IndianMongolianMoroccanNative HawaiianNavajoNepaleseNew ZealanderNicaraguanNigerianNorthern EuropeanNorwegianOkinawanOsageOttawaPaiutePakistaniPalestinianPanamanianParaguayanPennsylvania GermanPeruvianPimaPolishPortuguesePotawatomiPuebloPuerto RicanPuget Sound SalishRomanianRussianSalvadoranSamoanScandinavianScotch-IrishScottishSeminoleSenegaleseSerbianShoshoneSierra LeoneanSiouxSlavicSlovakSloveneSomaliSouth AfricanSouth AmericanSouth American IndianSoviet UnionSpaniardSpanishSpanish AmericanSpanish American IndianSri LankanSubsaharan AfricanSudaneseSwedishSwissSyrianTaiwaneseThaiTlingit-HaidaTohono O'OdhamTonganTrinidadian and TobagonianTsimshianTurkishU.S. Virgin IslanderUgandanUkrainianUruguayanUteVenezuelanVietnameseWelshWest IndianYakamaYaquiYugoslavianYumanYup'ikZimbabwean
Immigration
NonimmigrantsImmigrantsAfghanistanAfricaAlbaniaArgentinaArmeniaAsiaAustraliaAustriaBahamasBangladeshBarbadosBelarusBelgiumBelizeBoliviaBosnia and HerzegovinaBrazilBulgariaBurma/MyanmarCabo VerdeCambodiaCameroonCanadaCaribbeanCentral AmericaChileChinaColombiaCongoCosta RicaCroatiaCubaCzechoslovakiaDenmarkDominicaDominican RepublicEastern AfricaEastern AsiaEastern EuropeEcuadorEgyptEl SalvadorEnglandEritreaEthiopiaEuropeFijiFranceGermanyGhanaGreeceGrenadaGuatemalaGuyanaHaitiHondurasHong KongHungaryIndiaIndonesiaIranIraqIrelandIsraelItalyJamaicaJapanJordanKazakhstanKenyaKoreaKuwaitLaosLatin AmericaLatviaLebanonLiberiaLithuaniaMalaysiaMexicoMicronesiaMiddle AfricaMoldovaMoroccoNepalNetherlandsNicaraguaNigeriaNorth AmericaNorth MacedoniaNorthern AfricaNorthern EuropeNorwayOceaniaPakistanPanamaPeruPhilippinesPolandPortugalRomaniaRussiaSaudi ArabiaScotlandSenegalSerbiaSierra LeoneSingaporeSomaliaSouth AfricaSouth AmericaSouth Central AsiaSouth Eastern AsiaSpainSri LankaSt. Vincent and the GrenadinesSudanSwedenSwitzerlandSyriaTaiwanThailandTrinidad and TobagoTurkeyUgandaUkraineUruguayUzbekistanVenezuelaVietnamWest IndiesWestern AfricaWestern AsiaWestern EuropeYemenZaireZimbabweAzores
Immigrants from Southern Europe
Race
Ancestry
AfghanAfricanAlaska NativeAlaskan AthabascanAlbanianAleutAlsatianAmericanApacheArabArapahoArgentineanArmenianAssyrian/Chaldean/SyriacAustralianAustrianBahamianBangladeshiBarbadianBasqueBelgianBelizeanBermudanBhutaneseBlackfeetBolivianBrazilianBritishBritish West IndianBulgarianBurmeseCajunCambodianCanadianCape VerdeanCarpatho RusynCelticCentral AmericanCentral American IndianCherokeeCheyenneChickasawChileanChineseChippewaChoctawColombianColvilleComancheCosta RicanCreeCreekCroatianCrowCubanCypriotCzechCzechoslovakianDanishDominicanDutchDutch West IndianEastern EuropeanEcuadorianEgyptianEnglishEstonianEthiopianEuropeanFijianFilipinoFinnishFrenchFrench American IndianFrench CanadianGermanGerman RussianGhanaianGreekGuamanian/ChamorroGuatemalanGuyaneseHaitianHmongHonduranHopiHoumaHungarianIcelanderIndian (Asian)IndonesianInupiatIranianIraqiIrishIroquoisIsraeliItalianJamaicanJapaneseJordanianKenyanKiowaKoreanLaotianLatvianLebaneseLiberianLithuanianLumbeeLuxembourgerMacedonianMalaysianMalteseMarshalleseMenomineeMexicanMexican American IndianMongolianMoroccanNative HawaiianNavajoNepaleseNew ZealanderNicaraguanNigerianNorthern EuropeanNorwegianOkinawanOsageOttawaPaiutePakistaniPalestinianPanamanianParaguayanPennsylvania GermanPeruvianPimaPolishPortuguesePotawatomiPuebloPuerto RicanPuget Sound SalishRomanianRussianSalvadoranSamoanScandinavianScotch-IrishScottishSeminoleSenegaleseSerbianShoshoneSierra LeoneanSiouxSlavicSlovakSloveneSomaliSouth AfricanSouth AmericanSouth American IndianSoviet UnionSpaniardSpanishSpanish AmericanSpanish American IndianSri LankanSubsaharan AfricanSudaneseSwedishSwissSyrianTaiwaneseThaiTlingit-HaidaTohono O'OdhamTonganTrinidadian and TobagonianTsimshianTurkishU.S. Virgin IslanderUgandanUkrainianUruguayanUteVenezuelanVietnameseWelshWest IndianYakamaYaquiYugoslavianYumanYup'ikZimbabwean
Immigration
NonimmigrantsImmigrantsAfghanistanAfricaAlbaniaArgentinaArmeniaAsiaAustraliaAustriaBahamasBangladeshBarbadosBelarusBelgiumBelizeBoliviaBosnia and HerzegovinaBrazilBulgariaBurma/MyanmarCabo VerdeCambodiaCameroonCanadaCaribbeanCentral AmericaChileChinaColombiaCongoCosta RicaCroatiaCubaCzechoslovakiaDenmarkDominicaDominican RepublicEastern AfricaEastern AsiaEastern EuropeEcuadorEgyptEl SalvadorEnglandEritreaEthiopiaEuropeFijiFranceGermanyGhanaGreeceGrenadaGuatemalaGuyanaHaitiHondurasHong KongHungaryIndiaIndonesiaIranIraqIrelandIsraelItalyJamaicaJapanJordanKazakhstanKenyaKoreaKuwaitLaosLatin AmericaLatviaLebanonLiberiaLithuaniaMalaysiaMexicoMicronesiaMiddle AfricaMoldovaMoroccoNepalNetherlandsNicaraguaNigeriaNorth AmericaNorth MacedoniaNorthern AfricaNorthern EuropeNorwayOceaniaPakistanPanamaPeruPhilippinesPolandPortugalRomaniaRussiaSaudi ArabiaScotlandSenegalSerbiaSierra LeoneSingaporeSomaliaSouth AfricaSouth AmericaSouth Central AsiaSouth Eastern AsiaSouthern EuropeSpainSri LankaSt. Vincent and the GrenadinesSudanSwedenSwitzerlandSyriaTaiwanThailandTrinidad and TobagoTurkeyUgandaUkraineUruguayUzbekistanVenezuelaVietnamWest IndiesWestern AfricaWestern AsiaWestern EuropeYemenZaireZimbabweAzores
Seniors Poverty Over the Age of 75
Income
Poverty
Unemployment
Labor Participation
Family Structure
Vehicle Availability
Education Level
Disability

Seniors Poverty Over the Age of 75 Comparison

Delaware

Immigrants from Southern Europe

Exceptional
Poor
11.4%
SENIORS POVERTY OVER THE AGE OF 75
96.0/ 100
METRIC RATING
74th/ 347
METRIC RANK
12.7%
SENIORS POVERTY OVER THE AGE OF 75
10.7/ 100
METRIC RATING
203rd/ 347
METRIC RANK

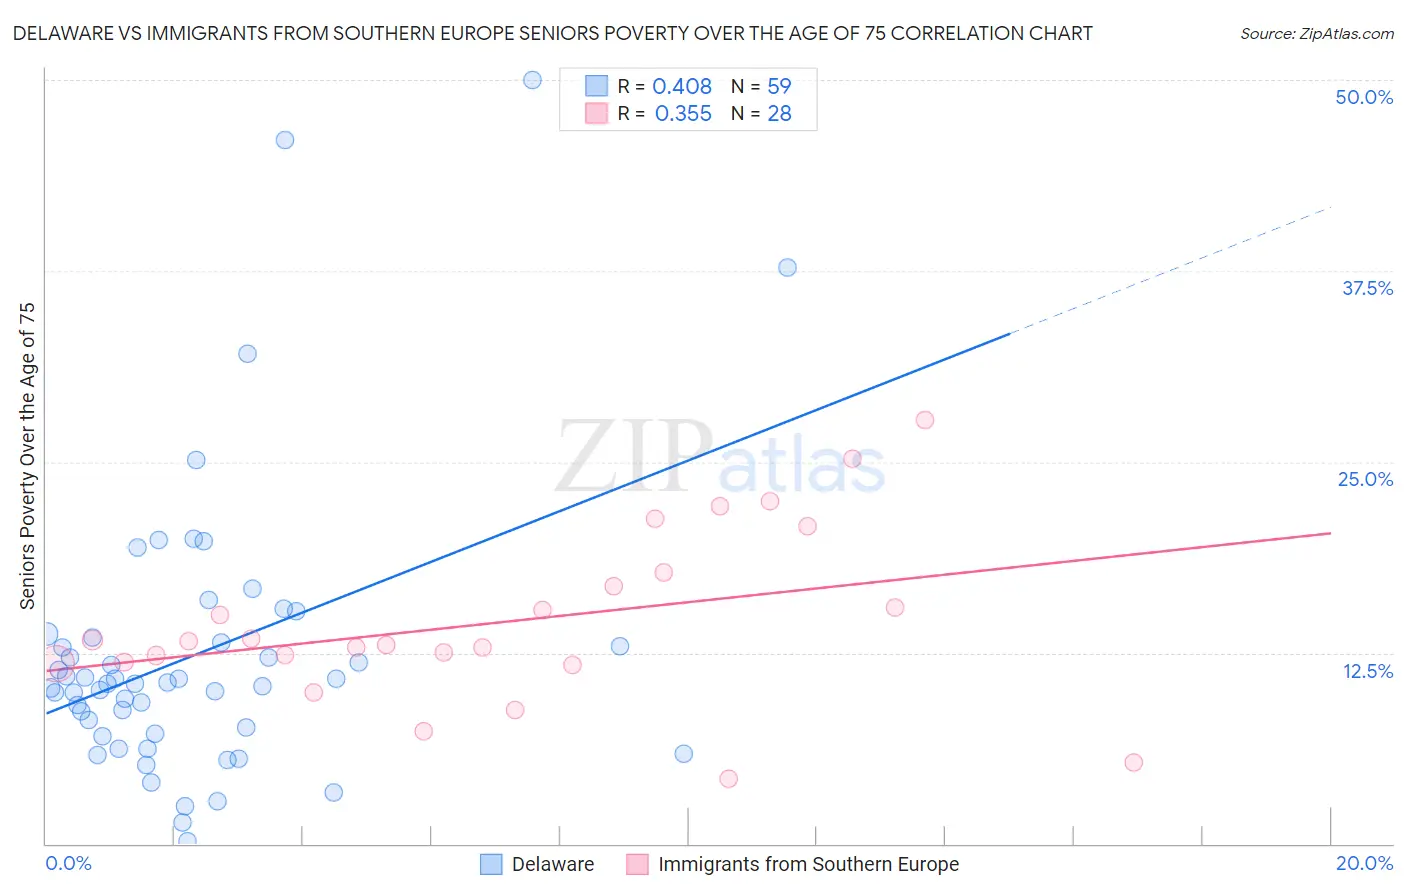
Delaware vs Immigrants from Southern Europe Seniors Poverty Over the Age of 75 Correlation Chart

The statistical analysis conducted on geographies consisting of 95,641,420 people shows a moderate positive correlation between the proportion of Delaware and poverty level among seniors over the age of 75 in the United States with a correlation coefficient (R) of 0.408 and weighted average of 11.4%. Similarly, the statistical analysis conducted on geographies consisting of 398,215,767 people shows a mild positive correlation between the proportion of Immigrants from Southern Europe and poverty level among seniors over the age of 75 in the United States with a correlation coefficient (R) of 0.355 and weighted average of 12.7%, a difference of 11.5%.
Delaware vs Immigrants from Southern Europe Seniors Poverty Over the Age of 75

Seniors Poverty Over the Age of 75 Correlation Summary

MeasurementDelawareImmigrants from Southern Europe
Minimum0.12%4.3%
Maximum50.0%27.7%
Range49.9%23.5%
Mean12.5%14.5%
Median10.5%13.1%
Interquartile 25% (IQ1)7.2%11.8%
Interquartile 75% (IQ3)13.5%17.3%
Interquartile Range (IQR)6.2%5.5%
Standard Deviation (Sample)9.4%5.6%
Standard Deviation (Population)9.3%5.5%

Similar Demographics by Seniors Poverty Over the Age of 75

Demographics Similar to Delaware by Seniors Poverty Over the Age of 75

In terms of seniors poverty over the age of 75, the demographic groups most similar to Delaware are Immigrants from Micronesia (11.4%, a difference of 0.010%), Sierra Leonean (11.4%, a difference of 0.10%), Palestinian (11.4%, a difference of 0.10%), French Canadian (11.4%, a difference of 0.16%), and Osage (11.4%, a difference of 0.20%).
DemographicsRating | RankSeniors Poverty Over the Age of 75
Bolivians
96.5
/100
|
#67
Exceptional
11.4%
Immigrants | Austria
96.5
/100
|
#68
Exceptional
11.4%
Ottawa
96.5
/100
|
#69
Exceptional
11.4%
Immigrants | South Central Asia
96.4
/100
|
#70
Exceptional
11.4%
Osage
96.3
/100
|
#71
Exceptional
11.4%
Sierra Leoneans
96.1
/100
|
#72
Exceptional
11.4%
Immigrants | Micronesia
96.0
/100
|
#73
Exceptional
11.4%
Delaware
96.0
/100
|
#74
Exceptional
11.4%
Palestinians
95.8
/100
|
#75
Exceptional
11.4%
French Canadians
95.7
/100
|
#76
Exceptional
11.4%
Whites/Caucasians
95.5
/100
|
#77
Exceptional
11.4%
Macedonians
95.5
/100
|
#78
Exceptional
11.4%
Filipinos
95.5
/100
|
#79
Exceptional
11.4%
Alaska Natives
95.4
/100
|
#80
Exceptional
11.4%
Basques
95.1
/100
|
#81
Exceptional
11.5%

Demographics Similar to Immigrants from Southern Europe by Seniors Poverty Over the Age of 75

In terms of seniors poverty over the age of 75, the demographic groups most similar to Immigrants from Southern Europe are Immigrants from Eritrea (12.7%, a difference of 0.030%), Arapaho (12.7%, a difference of 0.060%), Paraguayan (12.7%, a difference of 0.090%), Indian (Asian) (12.7%, a difference of 0.19%), and Albanian (12.7%, a difference of 0.23%).
DemographicsRating | RankSeniors Poverty Over the Age of 75
Immigrants | Eastern Europe
16.0
/100
|
#196
Poor
12.6%
Nepalese
14.4
/100
|
#197
Poor
12.6%
Chileans
13.7
/100
|
#198
Poor
12.6%
Immigrants | Lebanon
12.7
/100
|
#199
Poor
12.7%
Immigrants | Vietnam
12.1
/100
|
#200
Poor
12.7%
Paraguayans
11.1
/100
|
#201
Poor
12.7%
Arapaho
10.9
/100
|
#202
Poor
12.7%
Immigrants | Southern Europe
10.7
/100
|
#203
Poor
12.7%
Immigrants | Eritrea
10.5
/100
|
#204
Poor
12.7%
Indians (Asian)
9.7
/100
|
#205
Tragic
12.7%
Albanians
9.6
/100
|
#206
Tragic
12.7%
Costa Ricans
8.7
/100
|
#207
Tragic
12.8%
Immigrants | Eastern Asia
8.4
/100
|
#208
Tragic
12.8%
Immigrants | Liberia
7.3
/100
|
#209
Tragic
12.8%
Comanche
7.0
/100
|
#210
Tragic
12.8%