Immigrants from Israel vs Belizean Seniors Poverty Over the Age of 75
COMPARE
Immigrants from Israel
Belizean
Seniors Poverty Over the Age of 75
Seniors Poverty Over the Age of 75 Comparison
Immigrants from Israel
Belizeans
13.3%
SENIORS POVERTY OVER THE AGE OF 75
1.1/ 100
METRIC RATING
234th/ 347
METRIC RANK
14.8%
SENIORS POVERTY OVER THE AGE OF 75
0.0/ 100
METRIC RATING
281st/ 347
METRIC RANK
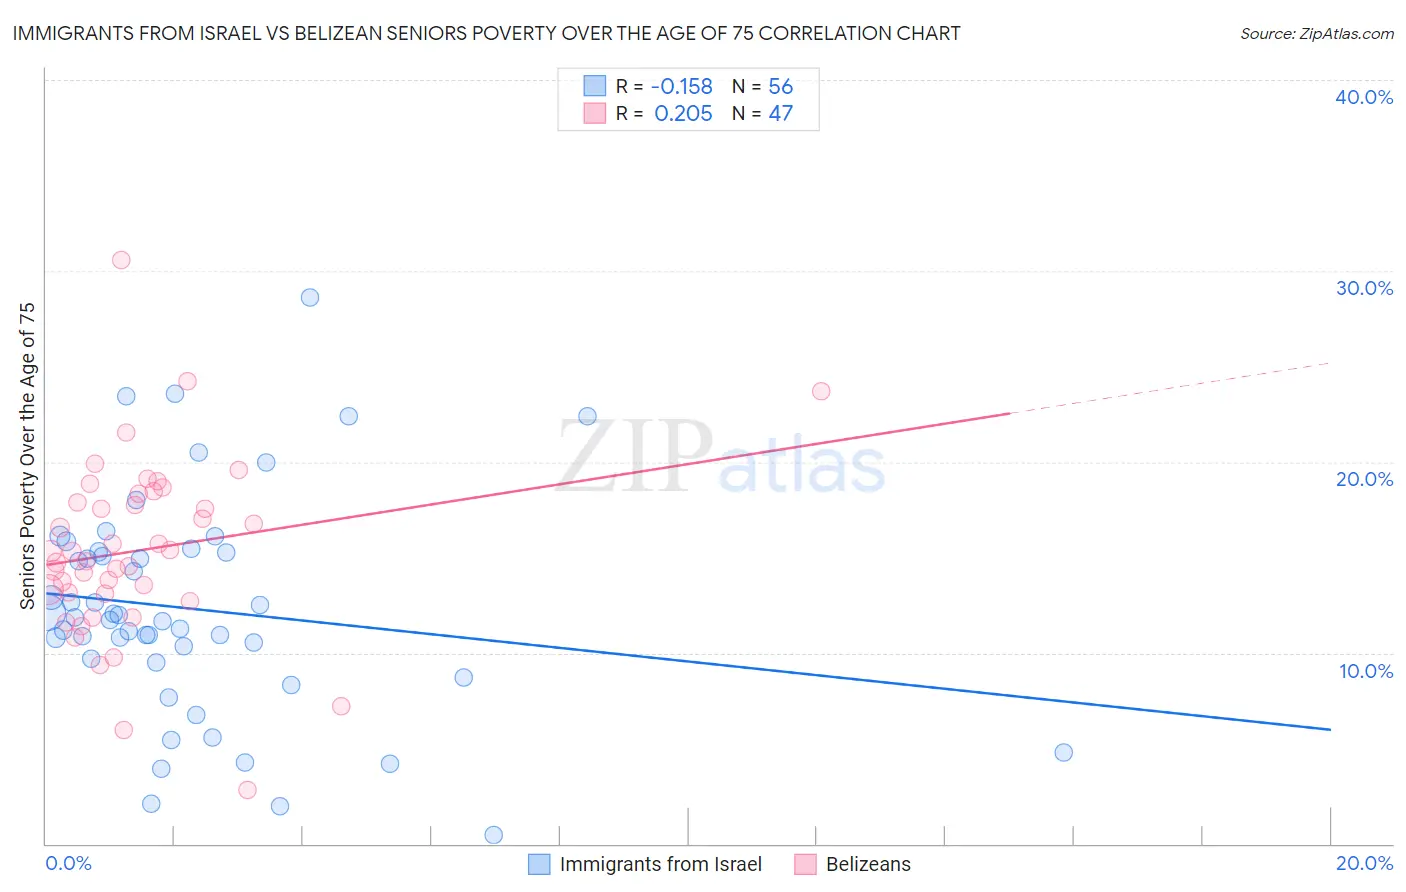
Immigrants from Israel vs Belizean Seniors Poverty Over the Age of 75 Correlation Chart
The statistical analysis conducted on geographies consisting of 208,700,044 people shows a poor negative correlation between the proportion of Immigrants from Israel and poverty level among seniors over the age of 75 in the United States with a correlation coefficient (R) of -0.158 and weighted average of 13.3%. Similarly, the statistical analysis conducted on geographies consisting of 143,767,946 people shows a weak positive correlation between the proportion of Belizeans and poverty level among seniors over the age of 75 in the United States with a correlation coefficient (R) of 0.205 and weighted average of 14.8%, a difference of 10.9%.
Seniors Poverty Over the Age of 75 Correlation Summary
| Measurement | Immigrants from Israel | Belizean |
| Minimum | 0.44% | 2.8% |
| Maximum | 28.6% | 30.5% |
| Range | 28.2% | 27.7% |
| Mean | 12.3% | 15.4% |
| Median | 11.8% | 15.3% |
| Interquartile 25% (IQ1) | 9.6% | 13.1% |
| Interquartile 75% (IQ3) | 15.3% | 18.4% |
| Interquartile Range (IQR) | 5.7% | 5.2% |
| Standard Deviation (Sample) | 5.8% | 4.8% |
| Standard Deviation (Population) | 5.7% | 4.7% |
Similar Demographics by Seniors Poverty Over the Age of 75
Demographics Similar to Immigrants from Israel by Seniors Poverty Over the Age of 75
In terms of seniors poverty over the age of 75, the demographic groups most similar to Immigrants from Israel are Japanese (13.3%, a difference of 0.30%), Moroccan (13.3%, a difference of 0.31%), Immigrants from Costa Rica (13.3%, a difference of 0.35%), Immigrants from Chile (13.3%, a difference of 0.37%), and Alaskan Athabascan (13.4%, a difference of 0.49%).
| Demographics | Rating | Rank | Seniors Poverty Over the Age of 75 |
| Cree | 2.3 /100 | #227 | Tragic 13.1% |
| Israelis | 2.0 /100 | #228 | Tragic 13.2% |
| Somalis | 1.6 /100 | #229 | Tragic 13.2% |
| Immigrants | China | 1.5 /100 | #230 | Tragic 13.2% |
| Sub-Saharan Africans | 1.5 /100 | #231 | Tragic 13.2% |
| Immigrants | Chile | 1.3 /100 | #232 | Tragic 13.3% |
| Immigrants | Costa Rica | 1.3 /100 | #233 | Tragic 13.3% |
| Immigrants | Israel | 1.1 /100 | #234 | Tragic 13.3% |
| Japanese | 0.9 /100 | #235 | Tragic 13.3% |
| Moroccans | 0.9 /100 | #236 | Tragic 13.3% |
| Alaskan Athabascans | 0.8 /100 | #237 | Tragic 13.4% |
| Peruvians | 0.8 /100 | #238 | Tragic 13.4% |
| Panamanians | 0.8 /100 | #239 | Tragic 13.4% |
| Argentineans | 0.7 /100 | #240 | Tragic 13.4% |
| Immigrants | Russia | 0.6 /100 | #241 | Tragic 13.4% |
Demographics Similar to Belizeans by Seniors Poverty Over the Age of 75
In terms of seniors poverty over the age of 75, the demographic groups most similar to Belizeans are Central American (14.7%, a difference of 0.12%), Immigrants from Senegal (14.8%, a difference of 0.18%), Guatemalan (14.8%, a difference of 0.24%), Black/African American (14.6%, a difference of 0.76%), and Cheyenne (14.9%, a difference of 0.88%).
| Demographics | Rating | Rank | Seniors Poverty Over the Age of 75 |
| Immigrants | Bahamas | 0.0 /100 | #274 | Tragic 14.4% |
| Immigrants | El Salvador | 0.0 /100 | #275 | Tragic 14.5% |
| Soviet Union | 0.0 /100 | #276 | Tragic 14.5% |
| Senegalese | 0.0 /100 | #277 | Tragic 14.5% |
| Immigrants | Colombia | 0.0 /100 | #278 | Tragic 14.6% |
| Blacks/African Americans | 0.0 /100 | #279 | Tragic 14.6% |
| Central Americans | 0.0 /100 | #280 | Tragic 14.7% |
| Belizeans | 0.0 /100 | #281 | Tragic 14.8% |
| Immigrants | Senegal | 0.0 /100 | #282 | Tragic 14.8% |
| Guatemalans | 0.0 /100 | #283 | Tragic 14.8% |
| Cheyenne | 0.0 /100 | #284 | Tragic 14.9% |
| Immigrants | Mexico | 0.0 /100 | #285 | Tragic 14.9% |
| Immigrants | Central America | 0.0 /100 | #286 | Tragic 15.0% |
| Immigrants | Guatemala | 0.0 /100 | #287 | Tragic 15.1% |
| Jamaicans | 0.0 /100 | #288 | Tragic 15.1% |