Lebanese vs Belizean Seniors Poverty Over the Age of 75
COMPARE
Lebanese
Belizean
Seniors Poverty Over the Age of 75
Seniors Poverty Over the Age of 75 Comparison
Lebanese
Belizeans
11.9%
SENIORS POVERTY OVER THE AGE OF 75
78.3/ 100
METRIC RATING
132nd/ 347
METRIC RANK
14.8%
SENIORS POVERTY OVER THE AGE OF 75
0.0/ 100
METRIC RATING
281st/ 347
METRIC RANK
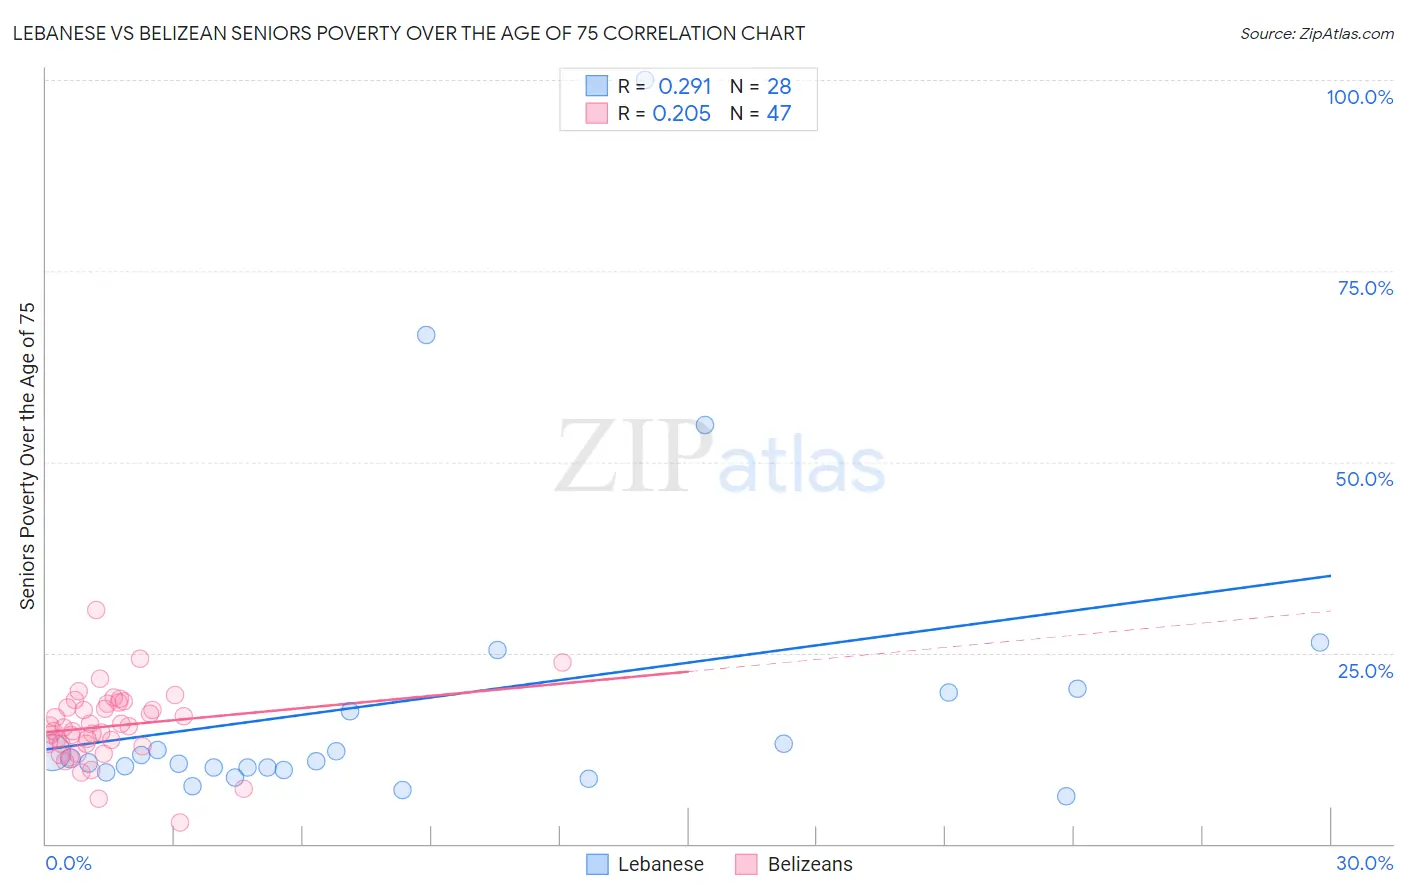
Lebanese vs Belizean Seniors Poverty Over the Age of 75 Correlation Chart
The statistical analysis conducted on geographies consisting of 396,652,503 people shows a weak positive correlation between the proportion of Lebanese and poverty level among seniors over the age of 75 in the United States with a correlation coefficient (R) of 0.291 and weighted average of 11.9%. Similarly, the statistical analysis conducted on geographies consisting of 143,767,946 people shows a weak positive correlation between the proportion of Belizeans and poverty level among seniors over the age of 75 in the United States with a correlation coefficient (R) of 0.205 and weighted average of 14.8%, a difference of 24.3%.
Seniors Poverty Over the Age of 75 Correlation Summary
| Measurement | Lebanese | Belizean |
| Minimum | 6.2% | 2.8% |
| Maximum | 100.0% | 30.5% |
| Range | 93.8% | 27.7% |
| Mean | 19.0% | 15.4% |
| Median | 11.0% | 15.3% |
| Interquartile 25% (IQ1) | 9.8% | 13.1% |
| Interquartile 75% (IQ3) | 18.6% | 18.4% |
| Interquartile Range (IQR) | 8.8% | 5.2% |
| Standard Deviation (Sample) | 21.0% | 4.8% |
| Standard Deviation (Population) | 20.6% | 4.7% |
Similar Demographics by Seniors Poverty Over the Age of 75
Demographics Similar to Lebanese by Seniors Poverty Over the Age of 75
In terms of seniors poverty over the age of 75, the demographic groups most similar to Lebanese are Immigrants from Sierra Leone (11.9%, a difference of 0.090%), Ugandan (11.9%, a difference of 0.15%), Immigrants from Western Europe (11.9%, a difference of 0.16%), Immigrants from Ireland (11.9%, a difference of 0.25%), and Spanish (11.8%, a difference of 0.28%).
| Demographics | Rating | Rank | Seniors Poverty Over the Age of 75 |
| Sudanese | 83.6 /100 | #125 | Excellent 11.8% |
| Pennsylvania Germans | 83.4 /100 | #126 | Excellent 11.8% |
| Immigrants | Denmark | 82.6 /100 | #127 | Excellent 11.8% |
| Immigrants | Hungary | 81.7 /100 | #128 | Excellent 11.8% |
| Ethiopians | 80.7 /100 | #129 | Excellent 11.8% |
| Spanish | 80.5 /100 | #130 | Excellent 11.8% |
| Immigrants | Western Europe | 79.6 /100 | #131 | Good 11.9% |
| Lebanese | 78.3 /100 | #132 | Good 11.9% |
| Immigrants | Sierra Leone | 77.6 /100 | #133 | Good 11.9% |
| Ugandans | 77.1 /100 | #134 | Good 11.9% |
| Immigrants | Ireland | 76.2 /100 | #135 | Good 11.9% |
| Immigrants | Philippines | 75.0 /100 | #136 | Good 11.9% |
| Immigrants | Moldova | 74.1 /100 | #137 | Good 11.9% |
| Immigrants | Romania | 72.6 /100 | #138 | Good 11.9% |
| Immigrants | Kenya | 72.6 /100 | #139 | Good 11.9% |
Demographics Similar to Belizeans by Seniors Poverty Over the Age of 75
In terms of seniors poverty over the age of 75, the demographic groups most similar to Belizeans are Central American (14.7%, a difference of 0.12%), Immigrants from Senegal (14.8%, a difference of 0.18%), Guatemalan (14.8%, a difference of 0.24%), Black/African American (14.6%, a difference of 0.76%), and Cheyenne (14.9%, a difference of 0.88%).
| Demographics | Rating | Rank | Seniors Poverty Over the Age of 75 |
| Immigrants | Bahamas | 0.0 /100 | #274 | Tragic 14.4% |
| Immigrants | El Salvador | 0.0 /100 | #275 | Tragic 14.5% |
| Soviet Union | 0.0 /100 | #276 | Tragic 14.5% |
| Senegalese | 0.0 /100 | #277 | Tragic 14.5% |
| Immigrants | Colombia | 0.0 /100 | #278 | Tragic 14.6% |
| Blacks/African Americans | 0.0 /100 | #279 | Tragic 14.6% |
| Central Americans | 0.0 /100 | #280 | Tragic 14.7% |
| Belizeans | 0.0 /100 | #281 | Tragic 14.8% |
| Immigrants | Senegal | 0.0 /100 | #282 | Tragic 14.8% |
| Guatemalans | 0.0 /100 | #283 | Tragic 14.8% |
| Cheyenne | 0.0 /100 | #284 | Tragic 14.9% |
| Immigrants | Mexico | 0.0 /100 | #285 | Tragic 14.9% |
| Immigrants | Central America | 0.0 /100 | #286 | Tragic 15.0% |
| Immigrants | Guatemala | 0.0 /100 | #287 | Tragic 15.1% |
| Jamaicans | 0.0 /100 | #288 | Tragic 15.1% |