Immigrants from Denmark vs Dutch West Indian Male Poverty
COMPARE
Immigrants from Denmark
Dutch West Indian
Male Poverty
Male Poverty Comparison
Immigrants from Denmark
Dutch West Indians
10.4%
MALE POVERTY
95.0/ 100
METRIC RATING
89th/ 347
METRIC RANK
14.2%
MALE POVERTY
0.0/ 100
METRIC RATING
307th/ 347
METRIC RANK
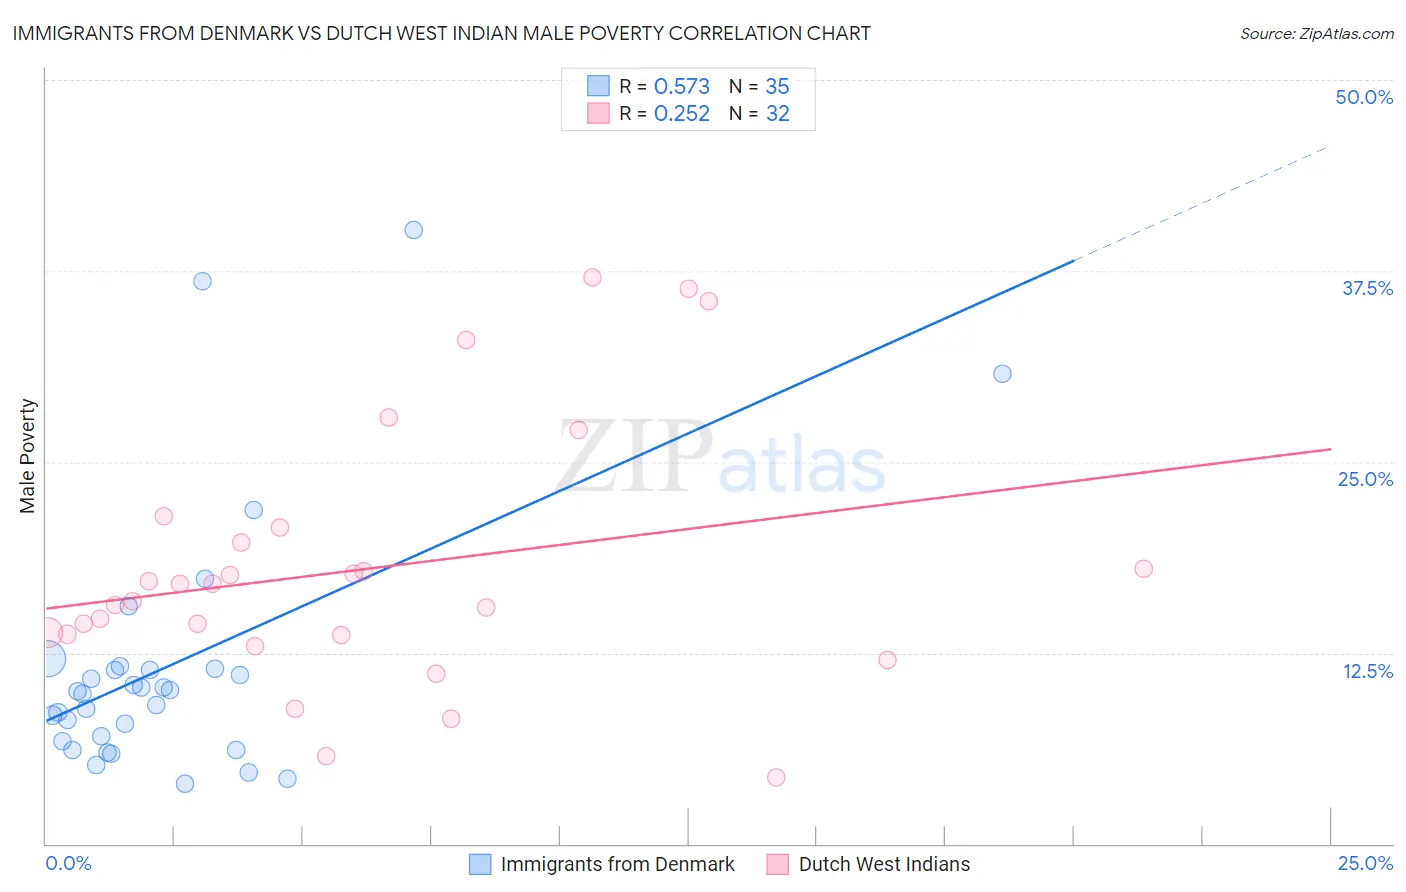
Immigrants from Denmark vs Dutch West Indian Male Poverty Correlation Chart
The statistical analysis conducted on geographies consisting of 136,389,161 people shows a substantial positive correlation between the proportion of Immigrants from Denmark and poverty level among males in the United States with a correlation coefficient (R) of 0.573 and weighted average of 10.4%. Similarly, the statistical analysis conducted on geographies consisting of 85,761,209 people shows a weak positive correlation between the proportion of Dutch West Indians and poverty level among males in the United States with a correlation coefficient (R) of 0.252 and weighted average of 14.2%, a difference of 36.8%.
Male Poverty Correlation Summary
| Measurement | Immigrants from Denmark | Dutch West Indian |
| Minimum | 4.0% | 4.3% |
| Maximum | 40.2% | 37.0% |
| Range | 36.2% | 32.7% |
| Mean | 11.7% | 18.0% |
| Median | 10.0% | 16.4% |
| Interquartile 25% (IQ1) | 6.7% | 13.7% |
| Interquartile 75% (IQ3) | 11.5% | 20.2% |
| Interquartile Range (IQR) | 4.8% | 6.5% |
| Standard Deviation (Sample) | 8.4% | 8.4% |
| Standard Deviation (Population) | 8.3% | 8.2% |
Similar Demographics by Male Poverty
Demographics Similar to Immigrants from Denmark by Male Poverty
In terms of male poverty, the demographic groups most similar to Immigrants from Denmark are Cambodian (10.4%, a difference of 0.0%), Indian (Asian) (10.4%, a difference of 0.020%), British (10.4%, a difference of 0.090%), Northern European (10.4%, a difference of 0.14%), and Immigrants from Eastern Asia (10.4%, a difference of 0.18%).
| Demographics | Rating | Rank | Male Poverty |
| Egyptians | 95.9 /100 | #82 | Exceptional 10.3% |
| Immigrants | Sweden | 95.7 /100 | #83 | Exceptional 10.3% |
| Czechoslovakians | 95.6 /100 | #84 | Exceptional 10.3% |
| Immigrants | England | 95.5 /100 | #85 | Exceptional 10.4% |
| Immigrants | Eastern Asia | 95.3 /100 | #86 | Exceptional 10.4% |
| Northern Europeans | 95.2 /100 | #87 | Exceptional 10.4% |
| Cambodians | 95.0 /100 | #88 | Exceptional 10.4% |
| Immigrants | Denmark | 95.0 /100 | #89 | Exceptional 10.4% |
| Indians (Asian) | 94.9 /100 | #90 | Exceptional 10.4% |
| British | 94.8 /100 | #91 | Exceptional 10.4% |
| Jordanians | 94.4 /100 | #92 | Exceptional 10.4% |
| Australians | 94.4 /100 | #93 | Exceptional 10.4% |
| Immigrants | South Africa | 94.1 /100 | #94 | Exceptional 10.4% |
| Scottish | 94.0 /100 | #95 | Exceptional 10.4% |
| Immigrants | Egypt | 93.7 /100 | #96 | Exceptional 10.4% |
Demographics Similar to Dutch West Indians by Male Poverty
In terms of male poverty, the demographic groups most similar to Dutch West Indians are African (14.2%, a difference of 0.020%), Somali (14.3%, a difference of 0.40%), Seminole (14.3%, a difference of 0.60%), Creek (14.1%, a difference of 0.70%), and Immigrants from Bangladesh (14.1%, a difference of 0.77%).
| Demographics | Rating | Rank | Male Poverty |
| Immigrants | Mexico | 0.0 /100 | #300 | Tragic 14.0% |
| Immigrants | Senegal | 0.0 /100 | #301 | Tragic 14.0% |
| Immigrants | Caribbean | 0.0 /100 | #302 | Tragic 14.0% |
| Bahamians | 0.0 /100 | #303 | Tragic 14.1% |
| Senegalese | 0.0 /100 | #304 | Tragic 14.1% |
| Immigrants | Bangladesh | 0.0 /100 | #305 | Tragic 14.1% |
| Creek | 0.0 /100 | #306 | Tragic 14.1% |
| Dutch West Indians | 0.0 /100 | #307 | Tragic 14.2% |
| Africans | 0.0 /100 | #308 | Tragic 14.2% |
| Somalis | 0.0 /100 | #309 | Tragic 14.3% |
| Seminole | 0.0 /100 | #310 | Tragic 14.3% |
| Hondurans | 0.0 /100 | #311 | Tragic 14.3% |
| Choctaw | 0.0 /100 | #312 | Tragic 14.4% |
| Immigrants | Somalia | 0.0 /100 | #313 | Tragic 14.6% |
| Immigrants | Honduras | 0.0 /100 | #314 | Tragic 14.6% |