Creek vs Czech Child Poverty Under the Age of 5
COMPARE
Creek
Czech
Child Poverty Under the Age of 5
Child Poverty Under the Age of 5 Comparison
Creek
Czechs
24.2%
CHILD POVERTY UNDER THE AGE OF 5
0.0/ 100
METRIC RATING
330th/ 347
METRIC RANK
15.5%
CHILD POVERTY UNDER THE AGE OF 5
97.8/ 100
METRIC RATING
81st/ 347
METRIC RANK
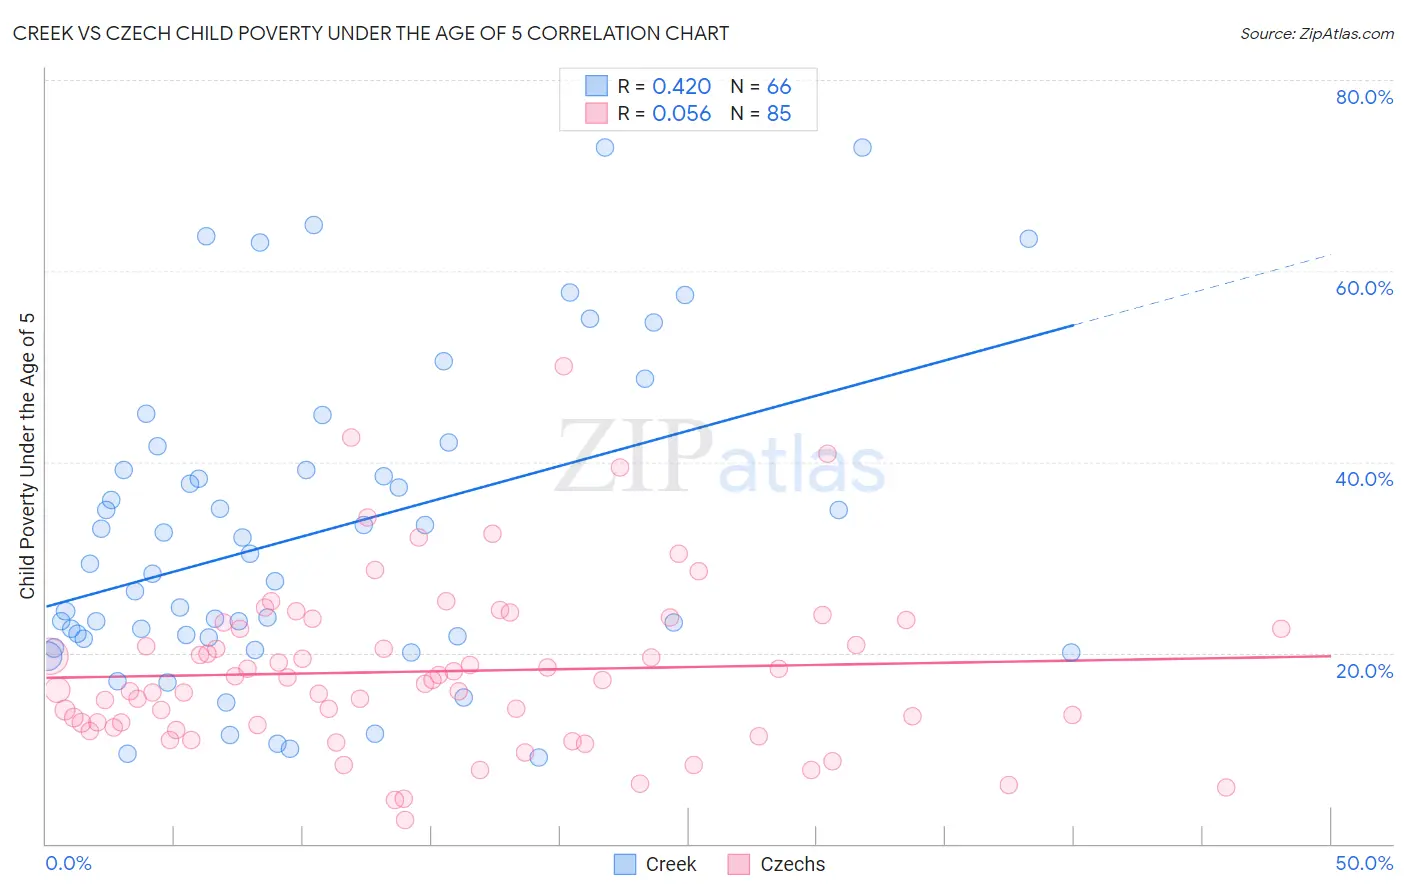
Creek vs Czech Child Poverty Under the Age of 5 Correlation Chart
The statistical analysis conducted on geographies consisting of 175,779,647 people shows a moderate positive correlation between the proportion of Creek and poverty level among children under the age of 5 in the United States with a correlation coefficient (R) of 0.420 and weighted average of 24.2%. Similarly, the statistical analysis conducted on geographies consisting of 456,271,620 people shows a slight positive correlation between the proportion of Czechs and poverty level among children under the age of 5 in the United States with a correlation coefficient (R) of 0.056 and weighted average of 15.5%, a difference of 55.9%.
Child Poverty Under the Age of 5 Correlation Summary
| Measurement | Creek | Czech |
| Minimum | 9.1% | 2.6% |
| Maximum | 73.0% | 50.0% |
| Range | 63.9% | 47.4% |
| Mean | 32.5% | 18.1% |
| Median | 28.8% | 17.2% |
| Interquartile 25% (IQ1) | 21.6% | 12.3% |
| Interquartile 75% (IQ3) | 39.1% | 22.9% |
| Interquartile Range (IQR) | 17.5% | 10.5% |
| Standard Deviation (Sample) | 16.2% | 8.8% |
| Standard Deviation (Population) | 16.1% | 8.7% |
Similar Demographics by Child Poverty Under the Age of 5
Demographics Similar to Creek by Child Poverty Under the Age of 5
In terms of child poverty under the age of 5, the demographic groups most similar to Creek are Cajun (24.1%, a difference of 0.44%), Immigrants from Dominican Republic (24.1%, a difference of 0.67%), Dominican (24.0%, a difference of 0.76%), Kiowa (24.5%, a difference of 1.0%), and Central American Indian (23.9%, a difference of 1.2%).
| Demographics | Rating | Rank | Child Poverty Under the Age of 5 |
| Pueblo | 0.0 /100 | #323 | Tragic 23.7% |
| Paiute | 0.0 /100 | #324 | Tragic 23.8% |
| Immigrants | Congo | 0.0 /100 | #325 | Tragic 23.9% |
| Central American Indians | 0.0 /100 | #326 | Tragic 23.9% |
| Dominicans | 0.0 /100 | #327 | Tragic 24.0% |
| Immigrants | Dominican Republic | 0.0 /100 | #328 | Tragic 24.1% |
| Cajuns | 0.0 /100 | #329 | Tragic 24.1% |
| Creek | 0.0 /100 | #330 | Tragic 24.2% |
| Kiowa | 0.0 /100 | #331 | Tragic 24.5% |
| Apache | 0.0 /100 | #332 | Tragic 25.0% |
| Natives/Alaskans | 0.0 /100 | #333 | Tragic 25.6% |
| Blacks/African Americans | 0.0 /100 | #334 | Tragic 25.7% |
| Colville | 0.0 /100 | #335 | Tragic 25.7% |
| Sioux | 0.0 /100 | #336 | Tragic 26.9% |
| Pima | 0.0 /100 | #337 | Tragic 27.4% |
Demographics Similar to Czechs by Child Poverty Under the Age of 5
In terms of child poverty under the age of 5, the demographic groups most similar to Czechs are Italian (15.5%, a difference of 0.11%), Immigrants from Italy (15.6%, a difference of 0.14%), Australian (15.5%, a difference of 0.23%), Chilean (15.6%, a difference of 0.30%), and Immigrants from Netherlands (15.6%, a difference of 0.32%).
| Demographics | Rating | Rank | Child Poverty Under the Age of 5 |
| Argentineans | 98.5 /100 | #74 | Exceptional 15.4% |
| Immigrants | Argentina | 98.5 /100 | #75 | Exceptional 15.4% |
| Croatians | 98.5 /100 | #76 | Exceptional 15.4% |
| Immigrants | Turkey | 98.3 /100 | #77 | Exceptional 15.4% |
| Sri Lankans | 98.1 /100 | #78 | Exceptional 15.5% |
| Australians | 98.0 /100 | #79 | Exceptional 15.5% |
| Italians | 97.9 /100 | #80 | Exceptional 15.5% |
| Czechs | 97.8 /100 | #81 | Exceptional 15.5% |
| Immigrants | Italy | 97.7 /100 | #82 | Exceptional 15.6% |
| Chileans | 97.6 /100 | #83 | Exceptional 15.6% |
| Immigrants | Netherlands | 97.6 /100 | #84 | Exceptional 15.6% |
| Immigrants | Latvia | 97.4 /100 | #85 | Exceptional 15.6% |
| Immigrants | Malaysia | 97.4 /100 | #86 | Exceptional 15.6% |
| Immigrants | Vietnam | 97.4 /100 | #87 | Exceptional 15.6% |
| Jordanians | 97.3 /100 | #88 | Exceptional 15.6% |