Sri Lankan vs Immigrants from Zimbabwe Child Poverty Among Boys Under 16
COMPARE
Sri Lankan
Immigrants from Zimbabwe
Child Poverty Among Boys Under 16
Child Poverty Among Boys Under 16 Comparison
Sri Lankans
Immigrants from Zimbabwe
14.9%
CHILD POVERTY AMONG BOYS UNDER 16
96.7/ 100
METRIC RATING
93rd/ 347
METRIC RANK
15.2%
CHILD POVERTY AMONG BOYS UNDER 16
94.2/ 100
METRIC RATING
111th/ 347
METRIC RANK
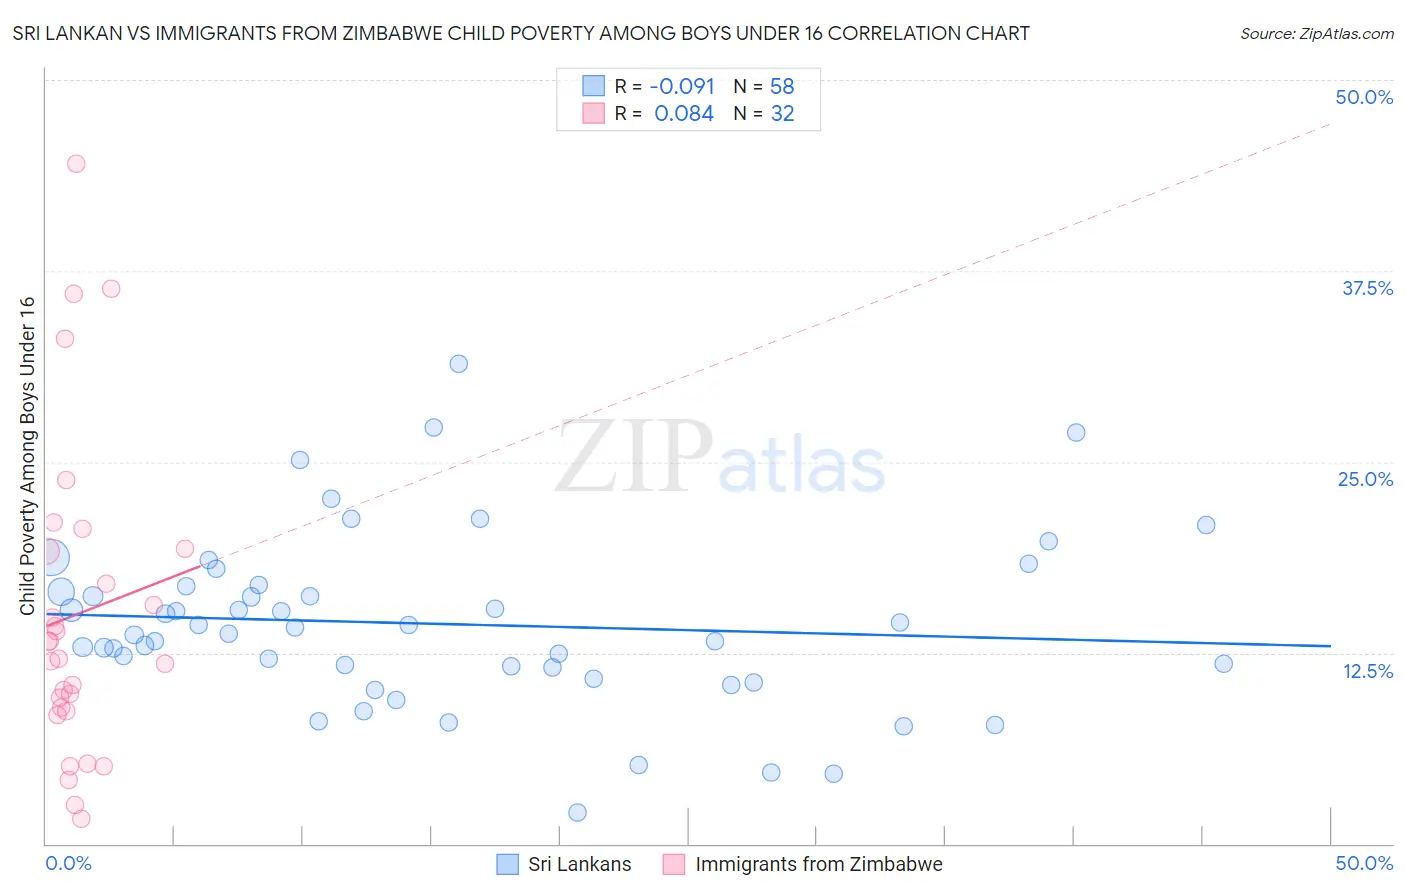
Sri Lankan vs Immigrants from Zimbabwe Child Poverty Among Boys Under 16 Correlation Chart
The statistical analysis conducted on geographies consisting of 433,188,416 people shows a slight negative correlation between the proportion of Sri Lankans and poverty level among boys under the age of 16 in the United States with a correlation coefficient (R) of -0.091 and weighted average of 14.9%. Similarly, the statistical analysis conducted on geographies consisting of 117,351,792 people shows a slight positive correlation between the proportion of Immigrants from Zimbabwe and poverty level among boys under the age of 16 in the United States with a correlation coefficient (R) of 0.084 and weighted average of 15.2%, a difference of 1.8%.
Child Poverty Among Boys Under 16 Correlation Summary
| Measurement | Sri Lankan | Immigrants from Zimbabwe |
| Minimum | 2.0% | 1.6% |
| Maximum | 31.4% | 44.5% |
| Range | 29.4% | 42.9% |
| Mean | 14.4% | 15.0% |
| Median | 14.0% | 12.7% |
| Interquartile 25% (IQ1) | 11.6% | 8.8% |
| Interquartile 75% (IQ3) | 16.8% | 19.2% |
| Interquartile Range (IQR) | 5.3% | 10.4% |
| Standard Deviation (Sample) | 5.7% | 10.3% |
| Standard Deviation (Population) | 5.6% | 10.1% |
Demographics Similar to Sri Lankans and Immigrants from Zimbabwe by Child Poverty Among Boys Under 16
In terms of child poverty among boys under 16, the demographic groups most similar to Sri Lankans are Immigrants from Italy (14.9%, a difference of 0.0%), Argentinean (14.9%, a difference of 0.050%), Finnish (14.9%, a difference of 0.11%), Immigrants from North Macedonia (14.9%, a difference of 0.36%), and Immigrants from Egypt (14.9%, a difference of 0.37%). Similarly, the demographic groups most similar to Immigrants from Zimbabwe are English (15.1%, a difference of 0.050%), Basque (15.2%, a difference of 0.20%), Pakistani (15.1%, a difference of 0.31%), Immigrants from England (15.1%, a difference of 0.35%), and Jordanian (15.1%, a difference of 0.52%).
| Demographics | Rating | Rank | Child Poverty Among Boys Under 16 |
| Argentineans | 96.7 /100 | #92 | Exceptional 14.9% |
| Sri Lankans | 96.7 /100 | #93 | Exceptional 14.9% |
| Immigrants | Italy | 96.7 /100 | #94 | Exceptional 14.9% |
| Finns | 96.5 /100 | #95 | Exceptional 14.9% |
| Immigrants | North Macedonia | 96.3 /100 | #96 | Exceptional 14.9% |
| Immigrants | Egypt | 96.2 /100 | #97 | Exceptional 14.9% |
| British | 96.2 /100 | #98 | Exceptional 15.0% |
| Immigrants | France | 96.1 /100 | #99 | Exceptional 15.0% |
| Chileans | 95.8 /100 | #100 | Exceptional 15.0% |
| Immigrants | Belarus | 95.7 /100 | #101 | Exceptional 15.0% |
| Romanians | 95.6 /100 | #102 | Exceptional 15.0% |
| Immigrants | Denmark | 95.6 /100 | #103 | Exceptional 15.0% |
| Immigrants | Switzerland | 95.4 /100 | #104 | Exceptional 15.0% |
| Dutch | 95.4 /100 | #105 | Exceptional 15.0% |
| Serbians | 95.2 /100 | #106 | Exceptional 15.1% |
| Jordanians | 95.1 /100 | #107 | Exceptional 15.1% |
| Immigrants | England | 94.8 /100 | #108 | Exceptional 15.1% |
| Pakistanis | 94.7 /100 | #109 | Exceptional 15.1% |
| English | 94.3 /100 | #110 | Exceptional 15.1% |
| Immigrants | Zimbabwe | 94.2 /100 | #111 | Exceptional 15.2% |
| Basques | 93.8 /100 | #112 | Exceptional 15.2% |