Costa Rican vs Croatian Female Poverty Among 25-34 Year Olds
COMPARE
Costa Rican
Croatian
Female Poverty Among 25-34 Year Olds
Female Poverty Among 25-34 Year Olds Comparison
Costa Ricans
Croatians
13.2%
FEMALE POVERTY AMONG 25-34 YEAR OLDS
75.8/ 100
METRIC RATING
151st/ 347
METRIC RANK
12.5%
FEMALE POVERTY AMONG 25-34 YEAR OLDS
97.5/ 100
METRIC RATING
86th/ 347
METRIC RANK
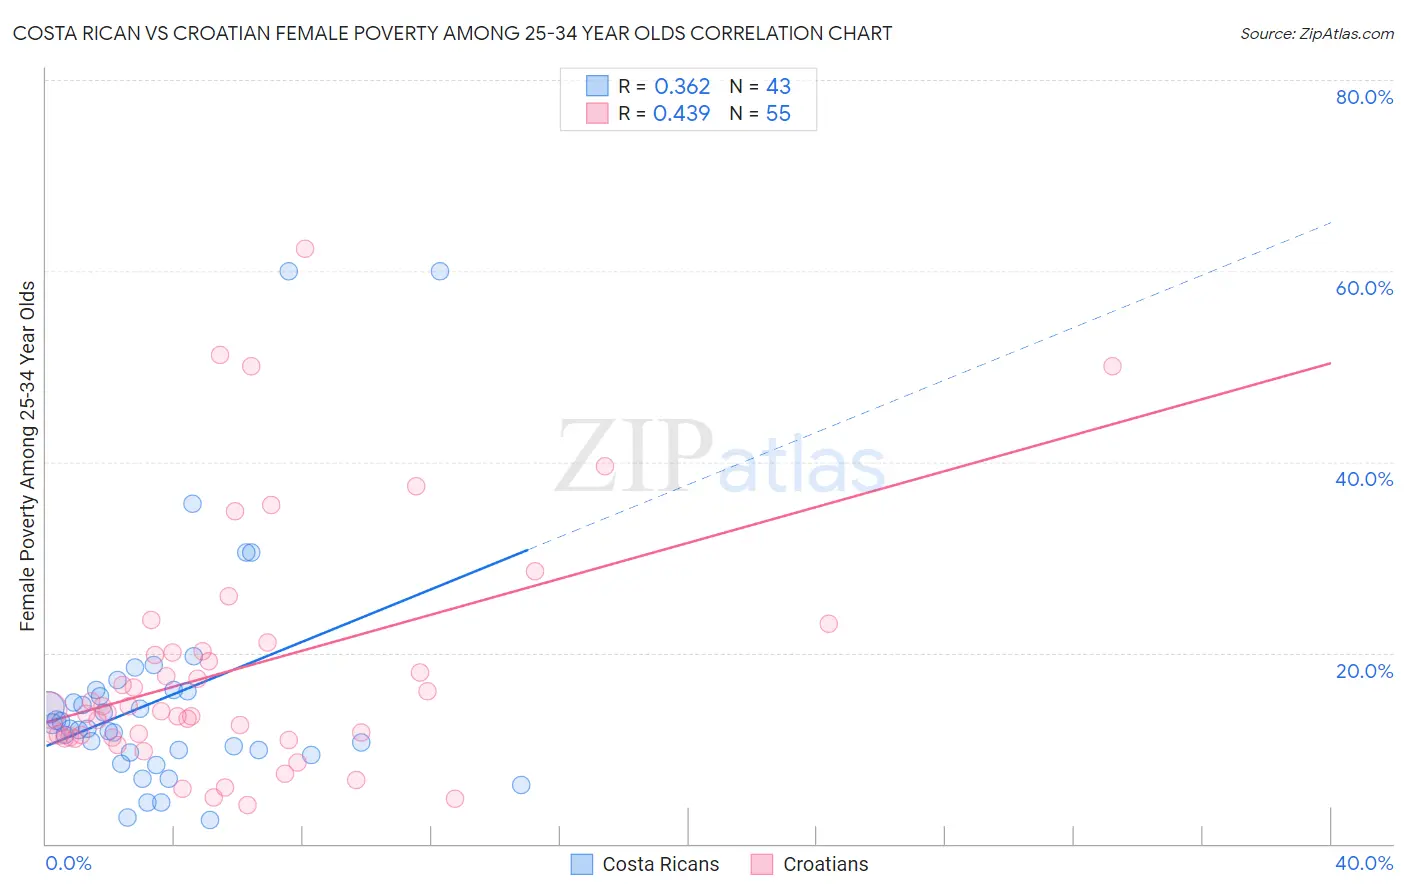
Costa Rican vs Croatian Female Poverty Among 25-34 Year Olds Correlation Chart
The statistical analysis conducted on geographies consisting of 251,732,871 people shows a mild positive correlation between the proportion of Costa Ricans and poverty level among females between the ages 25 and 34 in the United States with a correlation coefficient (R) of 0.362 and weighted average of 13.2%. Similarly, the statistical analysis conducted on geographies consisting of 368,515,977 people shows a moderate positive correlation between the proportion of Croatians and poverty level among females between the ages 25 and 34 in the United States with a correlation coefficient (R) of 0.439 and weighted average of 12.5%, a difference of 5.7%.
Female Poverty Among 25-34 Year Olds Correlation Summary
| Measurement | Costa Rican | Croatian |
| Minimum | 2.5% | 4.0% |
| Maximum | 60.0% | 62.3% |
| Range | 57.5% | 58.3% |
| Mean | 15.2% | 18.3% |
| Median | 12.1% | 13.9% |
| Interquartile 25% (IQ1) | 9.5% | 11.1% |
| Interquartile 75% (IQ3) | 16.1% | 20.2% |
| Interquartile Range (IQR) | 6.5% | 9.0% |
| Standard Deviation (Sample) | 12.1% | 12.7% |
| Standard Deviation (Population) | 11.9% | 12.6% |
Similar Demographics by Female Poverty Among 25-34 Year Olds
Demographics Similar to Costa Ricans by Female Poverty Among 25-34 Year Olds
In terms of female poverty among 25-34 year olds, the demographic groups most similar to Costa Ricans are Slavic (13.2%, a difference of 0.010%), Iraqi (13.2%, a difference of 0.030%), Sierra Leonean (13.2%, a difference of 0.050%), European (13.2%, a difference of 0.12%), and Lebanese (13.2%, a difference of 0.12%).
| Demographics | Rating | Rank | Female Poverty Among 25-34 Year Olds |
| Native Hawaiians | 78.9 /100 | #144 | Good 13.2% |
| Colombians | 77.2 /100 | #145 | Good 13.2% |
| South Americans | 76.9 /100 | #146 | Good 13.2% |
| Europeans | 76.8 /100 | #147 | Good 13.2% |
| Lebanese | 76.8 /100 | #148 | Good 13.2% |
| Sierra Leoneans | 76.3 /100 | #149 | Good 13.2% |
| Iraqis | 76.0 /100 | #150 | Good 13.2% |
| Costa Ricans | 75.8 /100 | #151 | Good 13.2% |
| Slavs | 75.7 /100 | #152 | Good 13.2% |
| Northern Europeans | 73.7 /100 | #153 | Good 13.2% |
| Arabs | 73.5 /100 | #154 | Good 13.2% |
| Immigrants | Sierra Leone | 72.9 /100 | #155 | Good 13.3% |
| Immigrants | Cameroon | 72.0 /100 | #156 | Good 13.3% |
| Immigrants | Western Europe | 70.3 /100 | #157 | Good 13.3% |
| Immigrants | Colombia | 69.2 /100 | #158 | Good 13.3% |
Demographics Similar to Croatians by Female Poverty Among 25-34 Year Olds
In terms of female poverty among 25-34 year olds, the demographic groups most similar to Croatians are Immigrants from South Eastern Asia (12.5%, a difference of 0.010%), Argentinean (12.5%, a difference of 0.030%), Immigrants from Austria (12.5%, a difference of 0.10%), Immigrants from Latvia (12.5%, a difference of 0.13%), and Albanian (12.5%, a difference of 0.18%).
| Demographics | Rating | Rank | Female Poverty Among 25-34 Year Olds |
| Immigrants | Jordan | 98.5 /100 | #79 | Exceptional 12.4% |
| Immigrants | Malaysia | 98.3 /100 | #80 | Exceptional 12.4% |
| Immigrants | Kazakhstan | 98.1 /100 | #81 | Exceptional 12.4% |
| Ethiopians | 98.0 /100 | #82 | Exceptional 12.4% |
| Albanians | 97.7 /100 | #83 | Exceptional 12.5% |
| Immigrants | Latvia | 97.7 /100 | #84 | Exceptional 12.5% |
| Immigrants | South Eastern Asia | 97.6 /100 | #85 | Exceptional 12.5% |
| Croatians | 97.5 /100 | #86 | Exceptional 12.5% |
| Argentineans | 97.5 /100 | #87 | Exceptional 12.5% |
| Immigrants | Austria | 97.4 /100 | #88 | Exceptional 12.5% |
| Italians | 97.2 /100 | #89 | Exceptional 12.5% |
| Immigrants | Albania | 97.1 /100 | #90 | Exceptional 12.5% |
| Norwegians | 96.9 /100 | #91 | Exceptional 12.6% |
| Immigrants | Armenia | 96.9 /100 | #92 | Exceptional 12.6% |
| Palestinians | 96.9 /100 | #93 | Exceptional 12.6% |