Polish vs Croatian Female Poverty Among 25-34 Year Olds
COMPARE
Polish
Croatian
Female Poverty Among 25-34 Year Olds
Female Poverty Among 25-34 Year Olds Comparison
Poles
Croatians
12.7%
FEMALE POVERTY AMONG 25-34 YEAR OLDS
94.9/ 100
METRIC RATING
107th/ 347
METRIC RANK
12.5%
FEMALE POVERTY AMONG 25-34 YEAR OLDS
97.5/ 100
METRIC RATING
86th/ 347
METRIC RANK
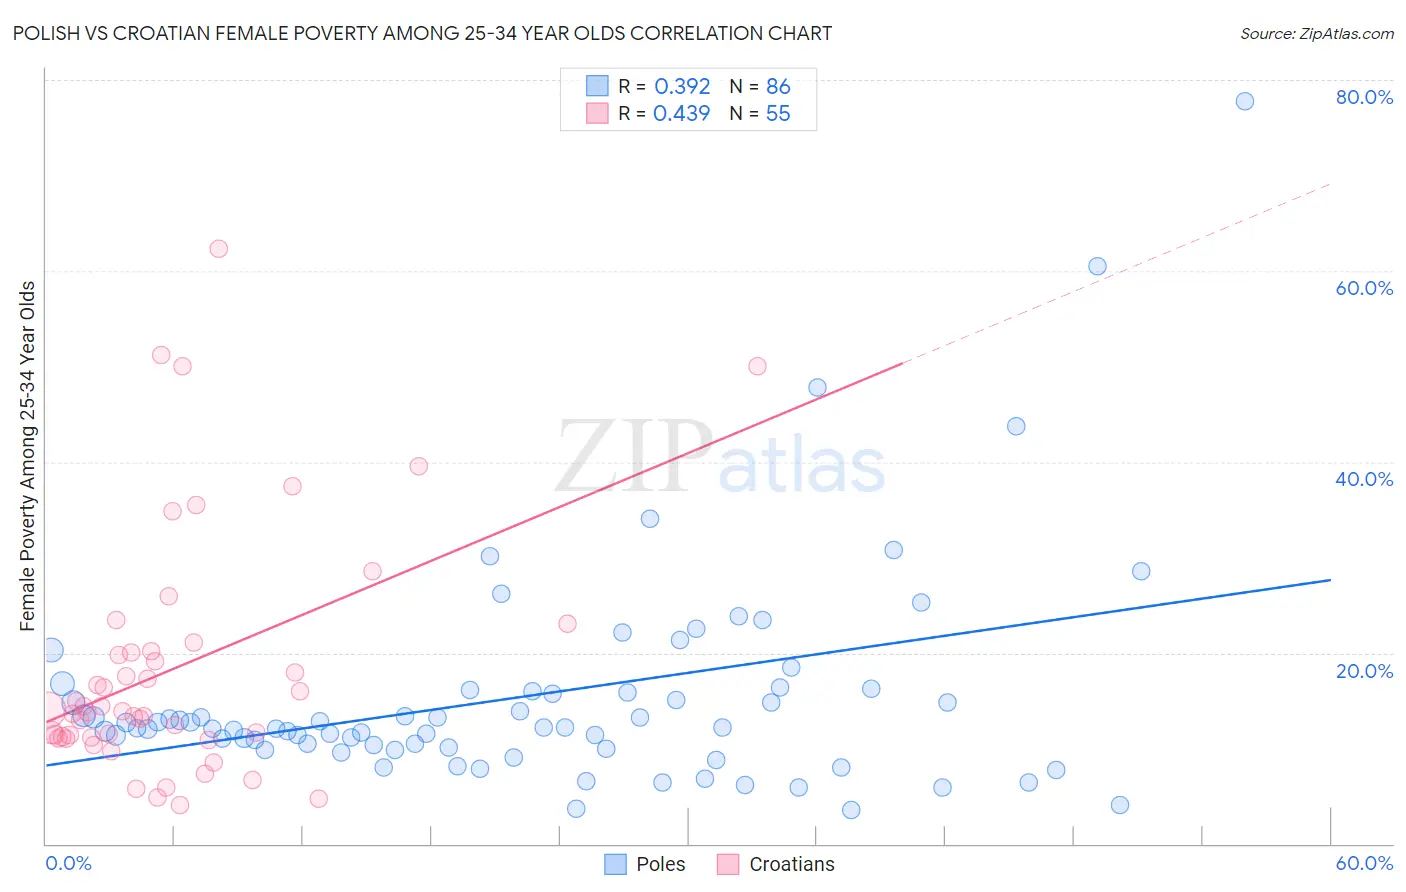
Polish vs Croatian Female Poverty Among 25-34 Year Olds Correlation Chart
The statistical analysis conducted on geographies consisting of 539,020,076 people shows a mild positive correlation between the proportion of Poles and poverty level among females between the ages 25 and 34 in the United States with a correlation coefficient (R) of 0.392 and weighted average of 12.7%. Similarly, the statistical analysis conducted on geographies consisting of 368,515,977 people shows a moderate positive correlation between the proportion of Croatians and poverty level among females between the ages 25 and 34 in the United States with a correlation coefficient (R) of 0.439 and weighted average of 12.5%, a difference of 1.7%.
Female Poverty Among 25-34 Year Olds Correlation Summary
| Measurement | Polish | Croatian |
| Minimum | 3.5% | 4.0% |
| Maximum | 77.8% | 62.3% |
| Range | 74.2% | 58.3% |
| Mean | 15.4% | 18.3% |
| Median | 12.2% | 13.9% |
| Interquartile 25% (IQ1) | 10.0% | 11.1% |
| Interquartile 75% (IQ3) | 15.9% | 20.2% |
| Interquartile Range (IQR) | 5.9% | 9.0% |
| Standard Deviation (Sample) | 11.5% | 12.7% |
| Standard Deviation (Population) | 11.4% | 12.6% |
Similar Demographics by Female Poverty Among 25-34 Year Olds
Demographics Similar to Poles by Female Poverty Among 25-34 Year Olds
In terms of female poverty among 25-34 year olds, the demographic groups most similar to Poles are Tsimshian (12.7%, a difference of 0.050%), Immigrants from South Africa (12.7%, a difference of 0.15%), Swedish (12.7%, a difference of 0.20%), Immigrants from Spain (12.7%, a difference of 0.25%), and Immigrants from Norway (12.7%, a difference of 0.25%).
| Demographics | Rating | Rank | Female Poverty Among 25-34 Year Olds |
| Immigrants | Denmark | 95.7 /100 | #100 | Exceptional 12.7% |
| Immigrants | Switzerland | 95.7 /100 | #101 | Exceptional 12.7% |
| Peruvians | 95.6 /100 | #102 | Exceptional 12.7% |
| Immigrants | Spain | 95.5 /100 | #103 | Exceptional 12.7% |
| Swedes | 95.4 /100 | #104 | Exceptional 12.7% |
| Immigrants | South Africa | 95.3 /100 | #105 | Exceptional 12.7% |
| Tsimshian | 95.1 /100 | #106 | Exceptional 12.7% |
| Poles | 94.9 /100 | #107 | Exceptional 12.7% |
| Immigrants | Norway | 94.4 /100 | #108 | Exceptional 12.7% |
| Immigrants | Peru | 94.3 /100 | #109 | Exceptional 12.7% |
| Australians | 94.1 /100 | #110 | Exceptional 12.8% |
| Danes | 93.9 /100 | #111 | Exceptional 12.8% |
| Immigrants | Morocco | 93.9 /100 | #112 | Exceptional 12.8% |
| Immigrants | Syria | 93.8 /100 | #113 | Exceptional 12.8% |
| Immigrants | Southern Europe | 93.6 /100 | #114 | Exceptional 12.8% |
Demographics Similar to Croatians by Female Poverty Among 25-34 Year Olds
In terms of female poverty among 25-34 year olds, the demographic groups most similar to Croatians are Immigrants from South Eastern Asia (12.5%, a difference of 0.010%), Argentinean (12.5%, a difference of 0.030%), Immigrants from Austria (12.5%, a difference of 0.10%), Immigrants from Latvia (12.5%, a difference of 0.13%), and Albanian (12.5%, a difference of 0.18%).
| Demographics | Rating | Rank | Female Poverty Among 25-34 Year Olds |
| Immigrants | Jordan | 98.5 /100 | #79 | Exceptional 12.4% |
| Immigrants | Malaysia | 98.3 /100 | #80 | Exceptional 12.4% |
| Immigrants | Kazakhstan | 98.1 /100 | #81 | Exceptional 12.4% |
| Ethiopians | 98.0 /100 | #82 | Exceptional 12.4% |
| Albanians | 97.7 /100 | #83 | Exceptional 12.5% |
| Immigrants | Latvia | 97.7 /100 | #84 | Exceptional 12.5% |
| Immigrants | South Eastern Asia | 97.6 /100 | #85 | Exceptional 12.5% |
| Croatians | 97.5 /100 | #86 | Exceptional 12.5% |
| Argentineans | 97.5 /100 | #87 | Exceptional 12.5% |
| Immigrants | Austria | 97.4 /100 | #88 | Exceptional 12.5% |
| Italians | 97.2 /100 | #89 | Exceptional 12.5% |
| Immigrants | Albania | 97.1 /100 | #90 | Exceptional 12.5% |
| Norwegians | 96.9 /100 | #91 | Exceptional 12.6% |
| Immigrants | Armenia | 96.9 /100 | #92 | Exceptional 12.6% |
| Palestinians | 96.9 /100 | #93 | Exceptional 12.6% |