Immigrants from Eastern Africa vs Iroquois Child Poverty Under the Age of 5

COMPARE

Immigrants from Eastern Africa
Race
Ancestry
AfghanAfricanAlaska NativeAlaskan AthabascanAlbanianAleutAlsatianAmericanApacheArabArapahoArgentineanArmenianAssyrian/Chaldean/SyriacAustralianAustrianBahamianBangladeshiBarbadianBasqueBelgianBelizeanBermudanBhutaneseBlackfeetBolivianBrazilianBritishBritish West IndianBulgarianBurmeseCajunCambodianCanadianCape VerdeanCarpatho RusynCelticCentral AmericanCentral American IndianCherokeeCheyenneChickasawChileanChineseChippewaChoctawColombianColvilleComancheCosta RicanCreeCreekCroatianCrowCubanCypriotCzechCzechoslovakianDanishDelawareDominicanDutchDutch West IndianEastern EuropeanEcuadorianEgyptianEnglishEstonianEthiopianEuropeanFijianFilipinoFinnishFrenchFrench American IndianFrench CanadianGermanGerman RussianGhanaianGreekGuamanian/ChamorroGuatemalanGuyaneseHaitianHmongHonduranHopiHoumaHungarianIcelanderIndian (Asian)IndonesianInupiatIranianIraqiIrishIsraeliItalianJamaicanJapaneseJordanianKenyanKiowaKoreanLaotianLatvianLebaneseLiberianLithuanianLumbeeLuxembourgerMacedonianMalaysianMalteseMarshalleseMenomineeMexicanMexican American IndianMongolianMoroccanNative HawaiianNavajoNepaleseNew ZealanderNicaraguanNigerianNorthern EuropeanNorwegianOkinawanOsageOttawaPaiutePakistaniPalestinianPanamanianParaguayanPennsylvania GermanPeruvianPimaPolishPortuguesePotawatomiPuebloPuerto RicanPuget Sound SalishRomanianRussianSalvadoranSamoanScandinavianScotch-IrishScottishSeminoleSenegaleseSerbianShoshoneSierra LeoneanSiouxSlavicSlovakSloveneSomaliSouth AfricanSouth AmericanSouth American IndianSoviet UnionSpaniardSpanishSpanish AmericanSpanish American IndianSri LankanSubsaharan AfricanSudaneseSwedishSwissSyrianTaiwaneseThaiTlingit-HaidaTohono O'OdhamTonganTrinidadian and TobagonianTsimshianTurkishU.S. Virgin IslanderUgandanUkrainianUruguayanUteVenezuelanVietnameseWelshWest IndianYakamaYaquiYugoslavianYumanYup'ikZimbabwean
Immigration
NonimmigrantsImmigrantsAfghanistanAfricaAlbaniaArgentinaArmeniaAsiaAustraliaAustriaBahamasBangladeshBarbadosBelarusBelgiumBelizeBoliviaBosnia and HerzegovinaBrazilBulgariaBurma/MyanmarCabo VerdeCambodiaCameroonCanadaCaribbeanCentral AmericaChileChinaColombiaCongoCosta RicaCroatiaCubaCzechoslovakiaDenmarkDominicaDominican RepublicEastern AfricaEastern AsiaEastern EuropeEcuadorEgyptEl SalvadorEnglandEritreaEthiopiaEuropeFijiFranceGermanyGhanaGreeceGrenadaGuatemalaGuyanaHaitiHondurasHong KongHungaryIndiaIndonesiaIranIraqIrelandIsraelItalyJamaicaJapanJordanKazakhstanKenyaKoreaKuwaitLaosLatin AmericaLatviaLebanonLiberiaLithuaniaMalaysiaMexicoMicronesiaMiddle AfricaMoldovaMoroccoNepalNetherlandsNicaraguaNigeriaNorth AmericaNorth MacedoniaNorthern AfricaNorthern EuropeNorwayOceaniaPakistanPanamaPeruPhilippinesPolandPortugalRomaniaRussiaSaudi ArabiaScotlandSenegalSerbiaSierra LeoneSingaporeSomaliaSouth AfricaSouth AmericaSouth Central AsiaSouth Eastern AsiaSouthern EuropeSpainSri LankaSt. Vincent and the GrenadinesSudanSwedenSwitzerlandSyriaTaiwanThailandTrinidad and TobagoTurkeyUgandaUkraineUruguayUzbekistanVenezuelaVietnamWest IndiesWestern AfricaWestern AsiaWestern EuropeYemenZaireZimbabweAzores
Iroquois
Race
Ancestry
AfghanAfricanAlaska NativeAlaskan AthabascanAlbanianAleutAlsatianAmericanApacheArabArapahoArgentineanArmenianAssyrian/Chaldean/SyriacAustralianAustrianBahamianBangladeshiBarbadianBasqueBelgianBelizeanBermudanBhutaneseBlackfeetBolivianBrazilianBritishBritish West IndianBulgarianBurmeseCajunCambodianCanadianCape VerdeanCarpatho RusynCelticCentral AmericanCentral American IndianCherokeeCheyenneChickasawChileanChineseChippewaChoctawColombianColvilleComancheCosta RicanCreeCreekCroatianCrowCubanCypriotCzechCzechoslovakianDanishDelawareDominicanDutchDutch West IndianEastern EuropeanEcuadorianEgyptianEnglishEstonianEthiopianEuropeanFijianFilipinoFinnishFrenchFrench American IndianFrench CanadianGermanGerman RussianGhanaianGreekGuamanian/ChamorroGuatemalanGuyaneseHaitianHmongHonduranHopiHoumaHungarianIcelanderIndian (Asian)IndonesianInupiatIranianIraqiIrishIroquoisIsraeliItalianJamaicanJapaneseJordanianKenyanKiowaKoreanLaotianLatvianLebaneseLiberianLithuanianLumbeeLuxembourgerMacedonianMalaysianMalteseMarshalleseMenomineeMexicanMexican American IndianMongolianMoroccanNative HawaiianNavajoNepaleseNew ZealanderNicaraguanNigerianNorthern EuropeanNorwegianOkinawanOsageOttawaPaiutePakistaniPalestinianPanamanianParaguayanPennsylvania GermanPeruvianPimaPolishPortuguesePotawatomiPuebloPuerto RicanPuget Sound SalishRomanianRussianSalvadoranSamoanScandinavianScotch-IrishScottishSeminoleSenegaleseSerbianShoshoneSierra LeoneanSiouxSlavicSlovakSloveneSomaliSouth AfricanSouth AmericanSouth American IndianSoviet UnionSpaniardSpanishSpanish AmericanSpanish American IndianSri LankanSubsaharan AfricanSudaneseSwedishSwissSyrianTaiwaneseThaiTlingit-HaidaTohono O'OdhamTonganTrinidadian and TobagonianTsimshianTurkishU.S. Virgin IslanderUgandanUkrainianUruguayanUteVenezuelanVietnameseWelshWest IndianYakamaYaquiYugoslavianYumanYup'ikZimbabwean
Immigration
NonimmigrantsImmigrantsAfghanistanAfricaAlbaniaArgentinaArmeniaAsiaAustraliaAustriaBahamasBangladeshBarbadosBelarusBelgiumBelizeBoliviaBosnia and HerzegovinaBrazilBulgariaBurma/MyanmarCabo VerdeCambodiaCameroonCanadaCaribbeanCentral AmericaChileChinaColombiaCongoCosta RicaCroatiaCubaCzechoslovakiaDenmarkDominicaDominican RepublicEastern AsiaEastern EuropeEcuadorEgyptEl SalvadorEnglandEritreaEthiopiaEuropeFijiFranceGermanyGhanaGreeceGrenadaGuatemalaGuyanaHaitiHondurasHong KongHungaryIndiaIndonesiaIranIraqIrelandIsraelItalyJamaicaJapanJordanKazakhstanKenyaKoreaKuwaitLaosLatin AmericaLatviaLebanonLiberiaLithuaniaMalaysiaMexicoMicronesiaMiddle AfricaMoldovaMoroccoNepalNetherlandsNicaraguaNigeriaNorth AmericaNorth MacedoniaNorthern AfricaNorthern EuropeNorwayOceaniaPakistanPanamaPeruPhilippinesPolandPortugalRomaniaRussiaSaudi ArabiaScotlandSenegalSerbiaSierra LeoneSingaporeSomaliaSouth AfricaSouth AmericaSouth Central AsiaSouth Eastern AsiaSouthern EuropeSpainSri LankaSt. Vincent and the GrenadinesSudanSwedenSwitzerlandSyriaTaiwanThailandTrinidad and TobagoTurkeyUgandaUkraineUruguayUzbekistanVenezuelaVietnamWest IndiesWestern AfricaWestern AsiaWestern EuropeYemenZaireZimbabweAzores
Child Poverty Under the Age of 5
Income
Poverty
Unemployment
Labor Participation
Family Structure
Vehicle Availability
Education Level
Disability

Child Poverty Under the Age of 5 Comparison

Immigrants from Eastern Africa

Iroquois

Poor
Tragic
18.1%
CHILD POVERTY UNDER THE AGE OF 5
13.4/ 100
METRIC RATING
204th/ 347
METRIC RANK
22.0%
CHILD POVERTY UNDER THE AGE OF 5
0.0/ 100
METRIC RATING
302nd/ 347
METRIC RANK

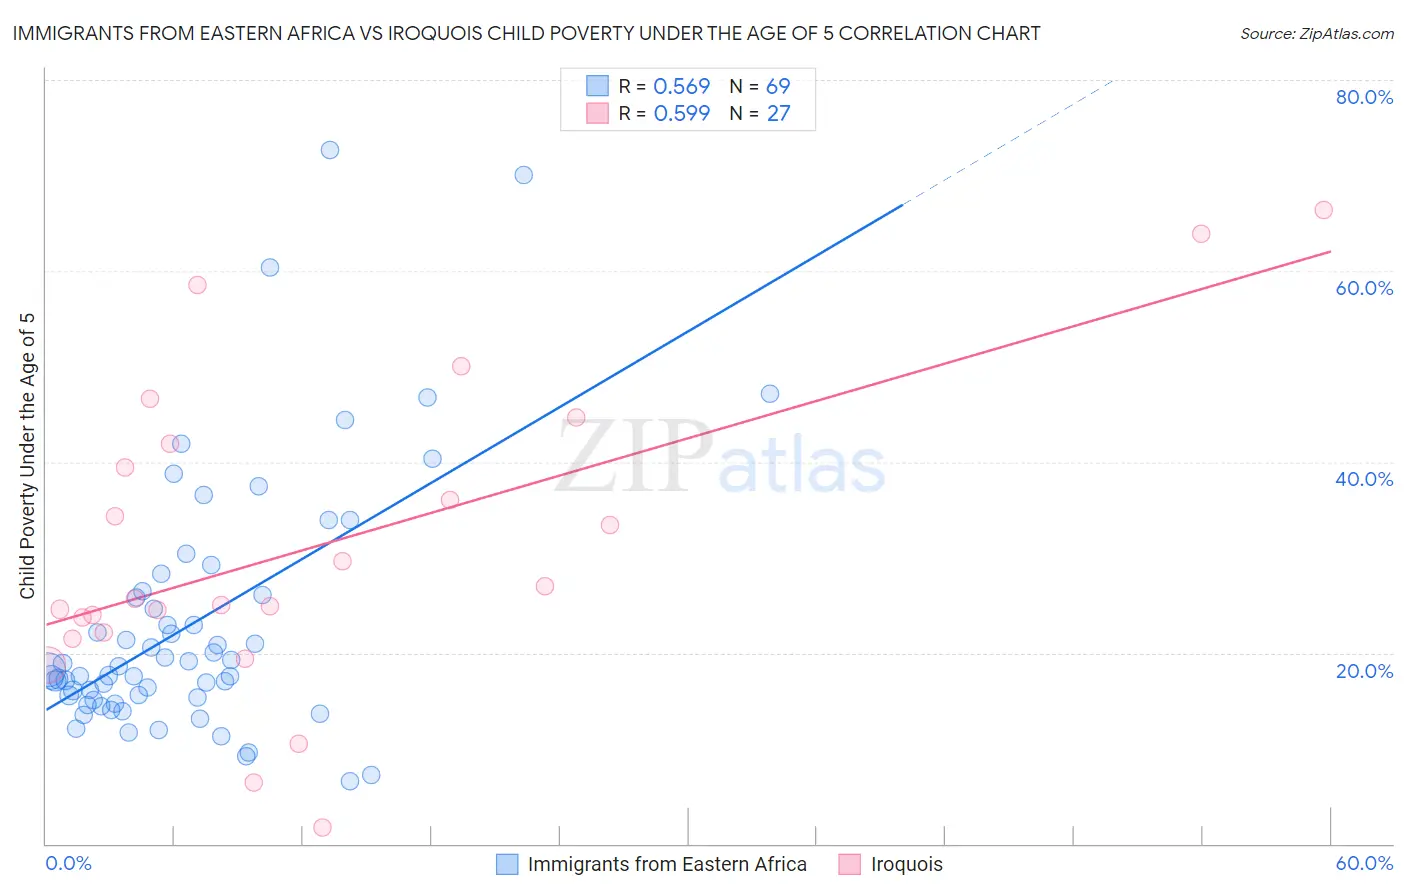
Immigrants from Eastern Africa vs Iroquois Child Poverty Under the Age of 5 Correlation Chart

The statistical analysis conducted on geographies consisting of 343,965,540 people shows a substantial positive correlation between the proportion of Immigrants from Eastern Africa and poverty level among children under the age of 5 in the United States with a correlation coefficient (R) of 0.569 and weighted average of 18.1%. Similarly, the statistical analysis conducted on geographies consisting of 202,992,045 people shows a substantial positive correlation between the proportion of Iroquois and poverty level among children under the age of 5 in the United States with a correlation coefficient (R) of 0.599 and weighted average of 22.0%, a difference of 21.8%.
Immigrants from Eastern Africa vs Iroquois Child Poverty Under the Age of 5

Child Poverty Under the Age of 5 Correlation Summary

MeasurementImmigrants from Eastern AfricaIroquois
Minimum6.5%1.6%
Maximum72.7%66.3%
Range66.2%64.7%
Mean23.1%31.3%
Median18.2%25.7%
Interquartile 25% (IQ1)15.2%22.1%
Interquartile 75% (IQ3)26.2%41.9%
Interquartile Range (IQR)11.0%19.8%
Standard Deviation (Sample)13.4%16.1%
Standard Deviation (Population)13.3%15.8%

Similar Demographics by Child Poverty Under the Age of 5

Demographics Similar to Immigrants from Eastern Africa by Child Poverty Under the Age of 5

In terms of child poverty under the age of 5, the demographic groups most similar to Immigrants from Eastern Africa are Immigrants from Cambodia (18.1%, a difference of 0.050%), Japanese (18.1%, a difference of 0.080%), Ugandan (18.0%, a difference of 0.090%), Iraqi (18.0%, a difference of 0.11%), and Spaniard (18.1%, a difference of 0.13%).
DemographicsRating | RankChild Poverty Under the Age of 5
Immigrants | Kenya
20.0
/100
|
#197
Fair
17.9%
Celtics
18.3
/100
|
#198
Poor
17.9%
Hungarians
18.3
/100
|
#199
Poor
17.9%
Iraqis
14.0
/100
|
#200
Poor
18.0%
Ugandans
13.9
/100
|
#201
Poor
18.0%
Japanese
13.8
/100
|
#202
Poor
18.1%
Immigrants | Cambodia
13.7
/100
|
#203
Poor
18.1%
Immigrants | Eastern Africa
13.4
/100
|
#204
Poor
18.1%
Spaniards
12.8
/100
|
#205
Poor
18.1%
Whites/Caucasians
12.6
/100
|
#206
Poor
18.1%
Immigrants | Immigrants
9.9
/100
|
#207
Tragic
18.2%
Scotch-Irish
9.8
/100
|
#208
Tragic
18.2%
Spanish
9.8
/100
|
#209
Tragic
18.2%
Panamanians
9.7
/100
|
#210
Tragic
18.2%
Moroccans
9.4
/100
|
#211
Tragic
18.2%

Demographics Similar to Iroquois by Child Poverty Under the Age of 5

In terms of child poverty under the age of 5, the demographic groups most similar to Iroquois are Inupiat (22.0%, a difference of 0.090%), Immigrants from Central America (22.0%, a difference of 0.17%), Immigrants from Guatemala (22.0%, a difference of 0.20%), Chickasaw (21.8%, a difference of 0.83%), and Alaskan Athabascan (21.8%, a difference of 0.83%).
DemographicsRating | RankChild Poverty Under the Age of 5
Cherokee
0.0
/100
|
#295
Tragic
21.7%
Yaqui
0.0
/100
|
#296
Tragic
21.7%
Hispanics or Latinos
0.0
/100
|
#297
Tragic
21.7%
Blackfeet
0.0
/100
|
#298
Tragic
21.8%
Chickasaw
0.0
/100
|
#299
Tragic
21.8%
Alaskan Athabascans
0.0
/100
|
#300
Tragic
21.8%
Immigrants | Central America
0.0
/100
|
#301
Tragic
22.0%
Iroquois
0.0
/100
|
#302
Tragic
22.0%
Inupiat
0.0
/100
|
#303
Tragic
22.0%
Immigrants | Guatemala
0.0
/100
|
#304
Tragic
22.0%
Immigrants | Mexico
0.0
/100
|
#305
Tragic
22.2%
Indonesians
0.0
/100
|
#306
Tragic
22.3%
Immigrants | Bahamas
0.0
/100
|
#307
Tragic
22.7%
Immigrants | Dominica
0.0
/100
|
#308
Tragic
22.7%
Houma
0.0
/100
|
#309
Tragic
22.7%