Soviet Union vs Slovene Female Poverty Among 18-24 Year Olds
COMPARE
Soviet Union
Slovene
Female Poverty Among 18-24 Year Olds
Female Poverty Among 18-24 Year Olds Comparison
Soviet Union
Slovenes
19.5%
FEMALE POVERTY AMONG 18-24 YEAR OLDS
92.0/ 100
METRIC RATING
135th/ 347
METRIC RANK
19.3%
FEMALE POVERTY AMONG 18-24 YEAR OLDS
96.2/ 100
METRIC RATING
114th/ 347
METRIC RANK
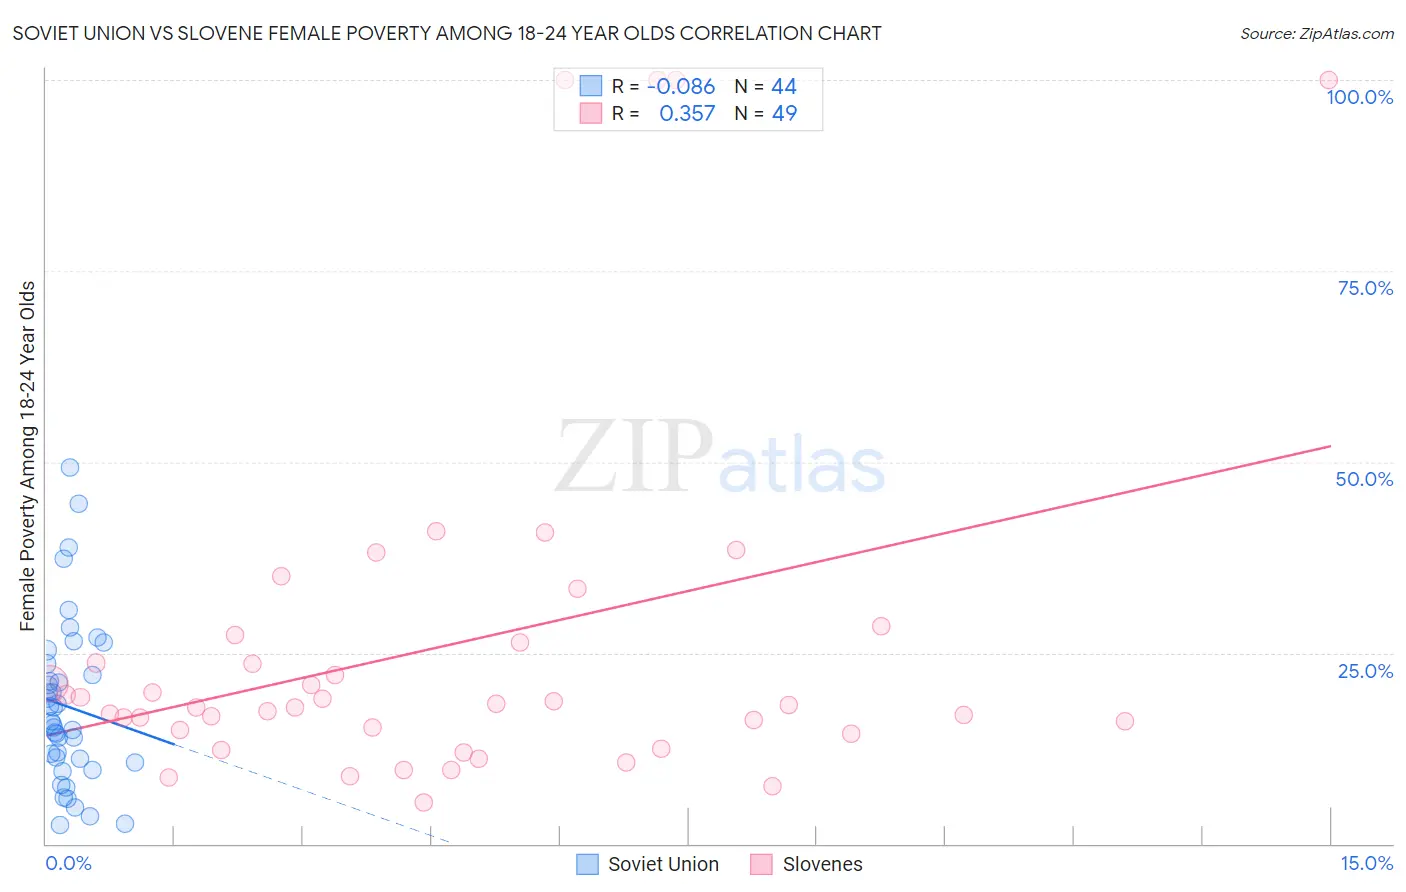
Soviet Union vs Slovene Female Poverty Among 18-24 Year Olds Correlation Chart
The statistical analysis conducted on geographies consisting of 43,300,584 people shows a slight negative correlation between the proportion of Soviet Union and poverty level among females between the ages 18 and 24 in the United States with a correlation coefficient (R) of -0.086 and weighted average of 19.5%. Similarly, the statistical analysis conducted on geographies consisting of 255,615,835 people shows a mild positive correlation between the proportion of Slovenes and poverty level among females between the ages 18 and 24 in the United States with a correlation coefficient (R) of 0.357 and weighted average of 19.3%, a difference of 1.0%.
Female Poverty Among 18-24 Year Olds Correlation Summary
| Measurement | Soviet Union | Slovene |
| Minimum | 2.4% | 5.4% |
| Maximum | 49.3% | 100.0% |
| Range | 46.8% | 94.6% |
| Mean | 18.0% | 26.0% |
| Median | 15.9% | 18.2% |
| Interquartile 25% (IQ1) | 10.9% | 14.6% |
| Interquartile 75% (IQ3) | 22.8% | 26.8% |
| Interquartile Range (IQR) | 11.9% | 12.2% |
| Standard Deviation (Sample) | 10.7% | 23.9% |
| Standard Deviation (Population) | 10.6% | 23.6% |
Similar Demographics by Female Poverty Among 18-24 Year Olds
Demographics Similar to Soviet Union by Female Poverty Among 18-24 Year Olds
In terms of female poverty among 18-24 year olds, the demographic groups most similar to Soviet Union are Immigrants from North America (19.5%, a difference of 0.010%), Jamaican (19.5%, a difference of 0.020%), Turkish (19.5%, a difference of 0.020%), Russian (19.5%, a difference of 0.090%), and Latvian (19.5%, a difference of 0.12%).
| Demographics | Rating | Rank | Female Poverty Among 18-24 Year Olds |
| Slovaks | 92.9 /100 | #128 | Exceptional 19.5% |
| Immigrants | England | 92.9 /100 | #129 | Exceptional 19.5% |
| Immigrants | Canada | 92.9 /100 | #130 | Exceptional 19.5% |
| Latvians | 92.7 /100 | #131 | Exceptional 19.5% |
| Jamaicans | 92.1 /100 | #132 | Exceptional 19.5% |
| Turks | 92.1 /100 | #133 | Exceptional 19.5% |
| Immigrants | North America | 92.1 /100 | #134 | Exceptional 19.5% |
| Soviet Union | 92.0 /100 | #135 | Exceptional 19.5% |
| Russians | 91.5 /100 | #136 | Exceptional 19.5% |
| Austrians | 90.7 /100 | #137 | Exceptional 19.5% |
| Immigrants | Morocco | 89.9 /100 | #138 | Excellent 19.6% |
| Indians (Asian) | 88.3 /100 | #139 | Excellent 19.6% |
| Immigrants | Trinidad and Tobago | 85.6 /100 | #140 | Excellent 19.7% |
| Pennsylvania Germans | 85.5 /100 | #141 | Excellent 19.7% |
| Panamanians | 84.6 /100 | #142 | Excellent 19.7% |
Demographics Similar to Slovenes by Female Poverty Among 18-24 Year Olds
In terms of female poverty among 18-24 year olds, the demographic groups most similar to Slovenes are Immigrants from Hungary (19.3%, a difference of 0.010%), Immigrants from Cameroon (19.3%, a difference of 0.040%), Immigrants from El Salvador (19.3%, a difference of 0.10%), Immigrants (19.3%, a difference of 0.11%), and Immigrants from Iran (19.3%, a difference of 0.15%).
| Demographics | Rating | Rank | Female Poverty Among 18-24 Year Olds |
| Immigrants | Sri Lanka | 97.5 /100 | #107 | Exceptional 19.2% |
| Immigrants | Uzbekistan | 97.3 /100 | #108 | Exceptional 19.2% |
| Immigrants | Syria | 97.2 /100 | #109 | Exceptional 19.2% |
| Laotians | 97.1 /100 | #110 | Exceptional 19.2% |
| Immigrants | Serbia | 97.1 /100 | #111 | Exceptional 19.2% |
| Immigrants | El Salvador | 96.5 /100 | #112 | Exceptional 19.3% |
| Immigrants | Cameroon | 96.3 /100 | #113 | Exceptional 19.3% |
| Slovenes | 96.2 /100 | #114 | Exceptional 19.3% |
| Immigrants | Hungary | 96.2 /100 | #115 | Exceptional 19.3% |
| Immigrants | Immigrants | 95.9 /100 | #116 | Exceptional 19.3% |
| Immigrants | Iran | 95.8 /100 | #117 | Exceptional 19.3% |
| Immigrants | Guyana | 95.6 /100 | #118 | Exceptional 19.3% |
| Cypriots | 95.5 /100 | #119 | Exceptional 19.3% |
| Immigrants | Northern Europe | 95.4 /100 | #120 | Exceptional 19.4% |
| Guyanese | 95.3 /100 | #121 | Exceptional 19.4% |