Colville vs Bolivian Child Poverty Under the Age of 16
COMPARE
Colville
Bolivian
Child Poverty Under the Age of 16
Child Poverty Under the Age of 16 Comparison
Colville
Bolivians
23.0%
CHILD POVERTY UNDER THE AGE OF 16
0.0/ 100
METRIC RATING
328th/ 347
METRIC RANK
13.2%
CHILD POVERTY UNDER THE AGE OF 16
99.8/ 100
METRIC RATING
26th/ 347
METRIC RANK
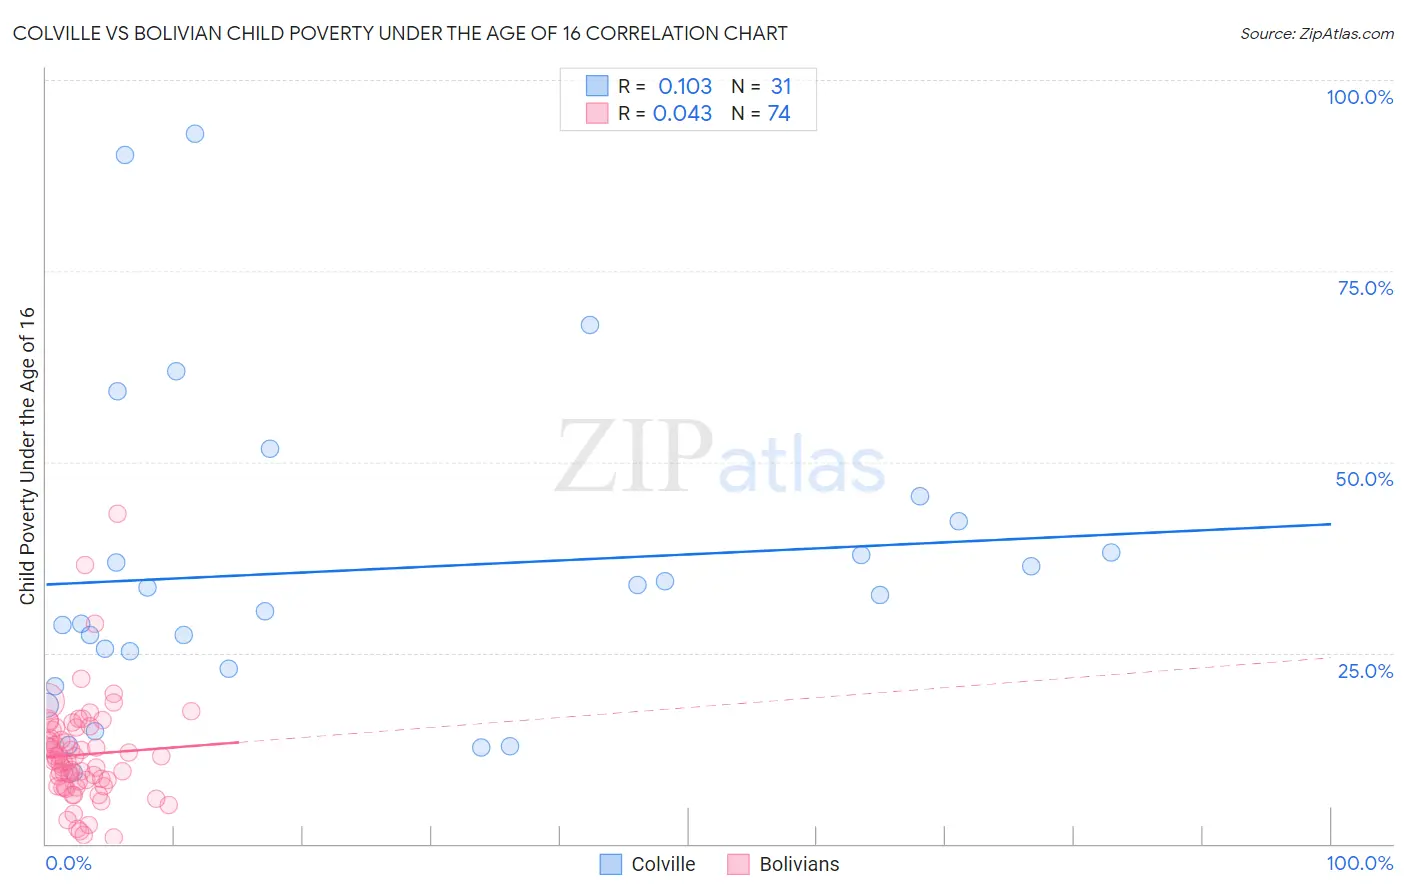
Colville vs Bolivian Child Poverty Under the Age of 16 Correlation Chart
The statistical analysis conducted on geographies consisting of 34,640,964 people shows a poor positive correlation between the proportion of Colville and poverty level among children under the age of 16 in the United States with a correlation coefficient (R) of 0.103 and weighted average of 23.0%. Similarly, the statistical analysis conducted on geographies consisting of 184,043,367 people shows no correlation between the proportion of Bolivians and poverty level among children under the age of 16 in the United States with a correlation coefficient (R) of 0.043 and weighted average of 13.2%, a difference of 74.1%.
Child Poverty Under the Age of 16 Correlation Summary
| Measurement | Colville | Bolivian |
| Minimum | 9.3% | 0.74% |
| Maximum | 93.0% | 43.1% |
| Range | 83.7% | 42.4% |
| Mean | 35.9% | 11.7% |
| Median | 32.6% | 10.8% |
| Interquartile 25% (IQ1) | 23.0% | 7.6% |
| Interquartile 75% (IQ3) | 42.3% | 14.9% |
| Interquartile Range (IQR) | 19.3% | 7.3% |
| Standard Deviation (Sample) | 20.7% | 6.9% |
| Standard Deviation (Population) | 20.4% | 6.8% |
Similar Demographics by Child Poverty Under the Age of 16
Demographics Similar to Colville by Child Poverty Under the Age of 16
In terms of child poverty under the age of 16, the demographic groups most similar to Colville are Menominee (23.0%, a difference of 0.38%), Immigrants from Honduras (22.7%, a difference of 1.5%), Immigrants from Congo (22.5%, a difference of 2.3%), Central American Indian (22.5%, a difference of 2.5%), and Paiute (22.4%, a difference of 2.8%).
| Demographics | Rating | Rank | Child Poverty Under the Age of 16 |
| Kiowa | 0.0 /100 | #321 | Tragic 22.2% |
| Hondurans | 0.0 /100 | #322 | Tragic 22.2% |
| Paiute | 0.0 /100 | #323 | Tragic 22.4% |
| Central American Indians | 0.0 /100 | #324 | Tragic 22.5% |
| Immigrants | Congo | 0.0 /100 | #325 | Tragic 22.5% |
| Immigrants | Honduras | 0.0 /100 | #326 | Tragic 22.7% |
| Menominee | 0.0 /100 | #327 | Tragic 23.0% |
| Colville | 0.0 /100 | #328 | Tragic 23.0% |
| Dominicans | 0.0 /100 | #329 | Tragic 23.8% |
| Natives/Alaskans | 0.0 /100 | #330 | Tragic 23.8% |
| Apache | 0.0 /100 | #331 | Tragic 23.8% |
| Pueblo | 0.0 /100 | #332 | Tragic 23.9% |
| Immigrants | Dominican Republic | 0.0 /100 | #333 | Tragic 24.0% |
| Blacks/African Americans | 0.0 /100 | #334 | Tragic 24.4% |
| Houma | 0.0 /100 | #335 | Tragic 24.9% |
Demographics Similar to Bolivians by Child Poverty Under the Age of 16
In terms of child poverty under the age of 16, the demographic groups most similar to Bolivians are Immigrants from China (13.3%, a difference of 0.29%), Eastern European (13.2%, a difference of 0.42%), Latvian (13.2%, a difference of 0.50%), Assyrian/Chaldean/Syriac (13.3%, a difference of 0.53%), and Indian (Asian) (13.1%, a difference of 0.71%).
| Demographics | Rating | Rank | Child Poverty Under the Age of 16 |
| Immigrants | Japan | 99.8 /100 | #19 | Exceptional 13.0% |
| Okinawans | 99.8 /100 | #20 | Exceptional 13.1% |
| Immigrants | Eastern Asia | 99.8 /100 | #21 | Exceptional 13.1% |
| Maltese | 99.8 /100 | #22 | Exceptional 13.1% |
| Indians (Asian) | 99.8 /100 | #23 | Exceptional 13.1% |
| Latvians | 99.8 /100 | #24 | Exceptional 13.2% |
| Eastern Europeans | 99.8 /100 | #25 | Exceptional 13.2% |
| Bolivians | 99.8 /100 | #26 | Exceptional 13.2% |
| Immigrants | China | 99.8 /100 | #27 | Exceptional 13.3% |
| Assyrians/Chaldeans/Syriacs | 99.7 /100 | #28 | Exceptional 13.3% |
| Swedes | 99.7 /100 | #29 | Exceptional 13.3% |
| Turks | 99.7 /100 | #30 | Exceptional 13.4% |
| Danes | 99.7 /100 | #31 | Exceptional 13.4% |
| Tongans | 99.7 /100 | #32 | Exceptional 13.4% |
| Asians | 99.6 /100 | #33 | Exceptional 13.5% |