Colville vs Immigrants from Indonesia Receiving Food Stamps
COMPARE
Colville
Immigrants from Indonesia
Receiving Food Stamps
Receiving Food Stamps Comparison
Colville
Immigrants from Indonesia
18.3%
RECEIVING FOOD STAMPS
0.0/ 100
METRIC RATING
328th/ 347
METRIC RANK
9.8%
RECEIVING FOOD STAMPS
99.0/ 100
METRIC RATING
67th/ 347
METRIC RANK
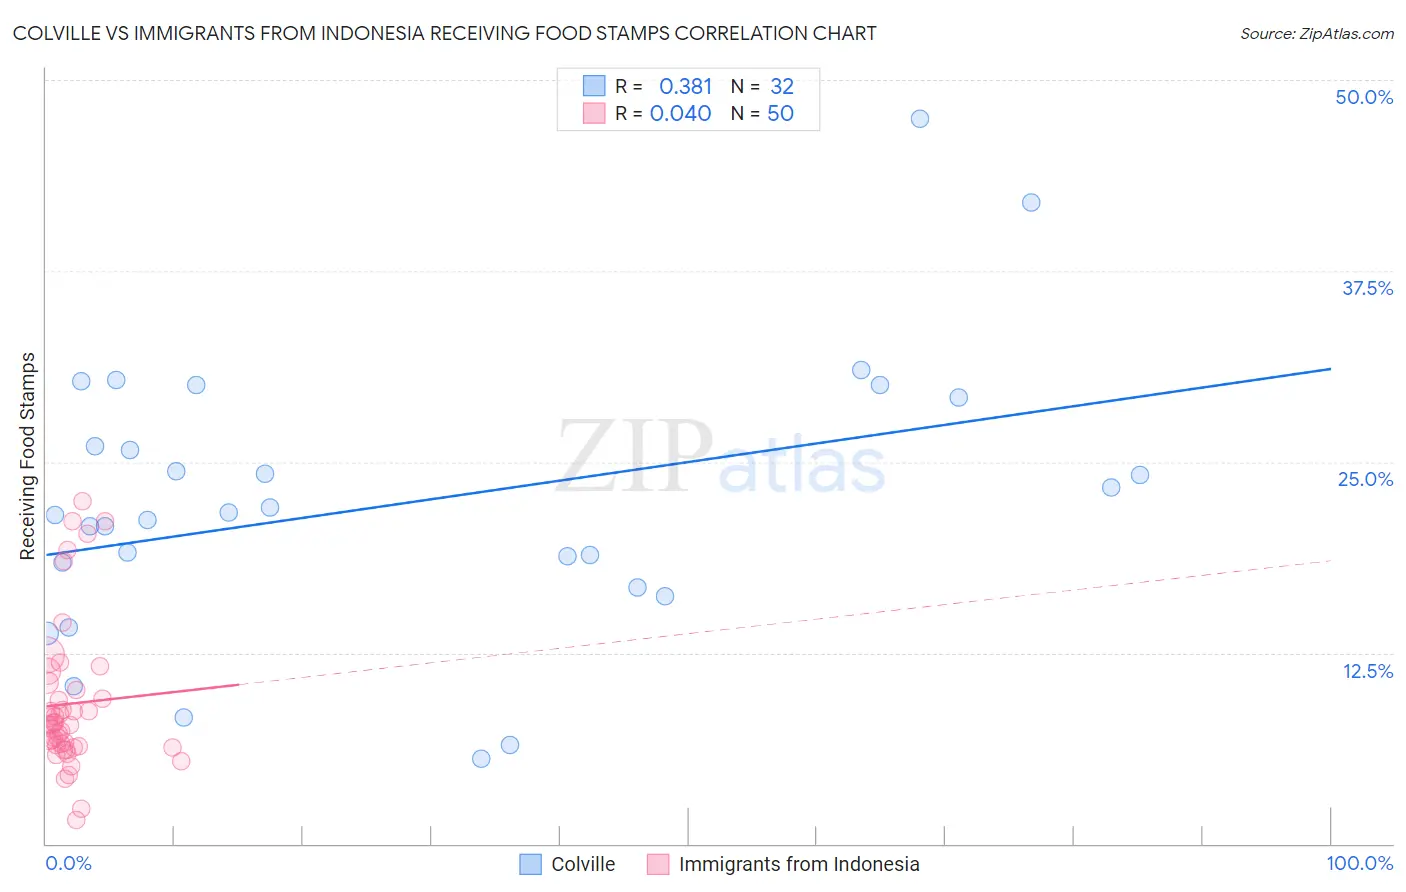
Colville vs Immigrants from Indonesia Receiving Food Stamps Correlation Chart
The statistical analysis conducted on geographies consisting of 34,677,374 people shows a mild positive correlation between the proportion of Colville and percentage of population receiving government assistance and/or food stamps in the United States with a correlation coefficient (R) of 0.381 and weighted average of 18.3%. Similarly, the statistical analysis conducted on geographies consisting of 215,507,406 people shows no correlation between the proportion of Immigrants from Indonesia and percentage of population receiving government assistance and/or food stamps in the United States with a correlation coefficient (R) of 0.040 and weighted average of 9.8%, a difference of 86.4%.
Receiving Food Stamps Correlation Summary
| Measurement | Colville | Immigrants from Indonesia |
| Minimum | 5.6% | 1.6% |
| Maximum | 47.5% | 22.4% |
| Range | 41.9% | 20.8% |
| Mean | 22.3% | 9.2% |
| Median | 21.6% | 7.8% |
| Interquartile 25% (IQ1) | 17.6% | 6.4% |
| Interquartile 75% (IQ3) | 27.6% | 10.1% |
| Interquartile Range (IQR) | 10.0% | 3.7% |
| Standard Deviation (Sample) | 9.1% | 4.8% |
| Standard Deviation (Population) | 8.9% | 4.8% |
Similar Demographics by Receiving Food Stamps
Demographics Similar to Colville by Receiving Food Stamps
In terms of receiving food stamps, the demographic groups most similar to Colville are Apache (18.3%, a difference of 0.21%), Immigrants from Dominica (18.4%, a difference of 0.46%), Cuban (18.2%, a difference of 0.52%), Immigrants from Haiti (18.2%, a difference of 0.63%), and British West Indian (17.9%, a difference of 2.4%).
| Demographics | Rating | Rank | Receiving Food Stamps |
| Natives/Alaskans | 0.0 /100 | #321 | Tragic 17.3% |
| Immigrants | Grenada | 0.0 /100 | #322 | Tragic 17.8% |
| Haitians | 0.0 /100 | #323 | Tragic 17.8% |
| British West Indians | 0.0 /100 | #324 | Tragic 17.9% |
| Immigrants | Haiti | 0.0 /100 | #325 | Tragic 18.2% |
| Cubans | 0.0 /100 | #326 | Tragic 18.2% |
| Apache | 0.0 /100 | #327 | Tragic 18.3% |
| Colville | 0.0 /100 | #328 | Tragic 18.3% |
| Immigrants | Dominica | 0.0 /100 | #329 | Tragic 18.4% |
| Pima | 0.0 /100 | #330 | Tragic 19.0% |
| Immigrants | Caribbean | 0.0 /100 | #331 | Tragic 19.6% |
| Pueblo | 0.0 /100 | #332 | Tragic 19.9% |
| Inupiat | 0.0 /100 | #333 | Tragic 20.1% |
| Yuman | 0.0 /100 | #334 | Tragic 20.2% |
| Immigrants | Cuba | 0.0 /100 | #335 | Tragic 20.8% |
Demographics Similar to Immigrants from Indonesia by Receiving Food Stamps
In terms of receiving food stamps, the demographic groups most similar to Immigrants from Indonesia are Northern European (9.8%, a difference of 0.060%), Slovene (9.8%, a difference of 0.16%), Italian (9.9%, a difference of 0.27%), Immigrants from Serbia (9.9%, a difference of 0.32%), and Immigrants from Turkey (9.8%, a difference of 0.36%).
| Demographics | Rating | Rank | Receiving Food Stamps |
| Germans | 99.2 /100 | #60 | Exceptional 9.7% |
| English | 99.2 /100 | #61 | Exceptional 9.8% |
| Immigrants | Bulgaria | 99.2 /100 | #62 | Exceptional 9.8% |
| Chinese | 99.2 /100 | #63 | Exceptional 9.8% |
| Immigrants | North America | 99.2 /100 | #64 | Exceptional 9.8% |
| Immigrants | Turkey | 99.1 /100 | #65 | Exceptional 9.8% |
| Slovenes | 99.1 /100 | #66 | Exceptional 9.8% |
| Immigrants | Indonesia | 99.0 /100 | #67 | Exceptional 9.8% |
| Northern Europeans | 99.0 /100 | #68 | Exceptional 9.8% |
| Italians | 99.0 /100 | #69 | Exceptional 9.9% |
| Immigrants | Serbia | 99.0 /100 | #70 | Exceptional 9.9% |
| Scottish | 98.9 /100 | #71 | Exceptional 9.9% |
| Immigrants | Asia | 98.9 /100 | #72 | Exceptional 9.9% |
| Macedonians | 98.9 /100 | #73 | Exceptional 9.9% |
| New Zealanders | 98.8 /100 | #74 | Exceptional 9.9% |