Choctaw vs Immigrants from Sri Lanka Child Poverty Among Boys Under 16
COMPARE
Choctaw
Immigrants from Sri Lanka
Child Poverty Among Boys Under 16
Child Poverty Among Boys Under 16 Comparison
Choctaw
Immigrants from Sri Lanka
21.3%
CHILD POVERTY AMONG BOYS UNDER 16
0.0/ 100
METRIC RATING
307th/ 347
METRIC RANK
13.9%
CHILD POVERTY AMONG BOYS UNDER 16
99.6/ 100
METRIC RATING
37th/ 347
METRIC RANK
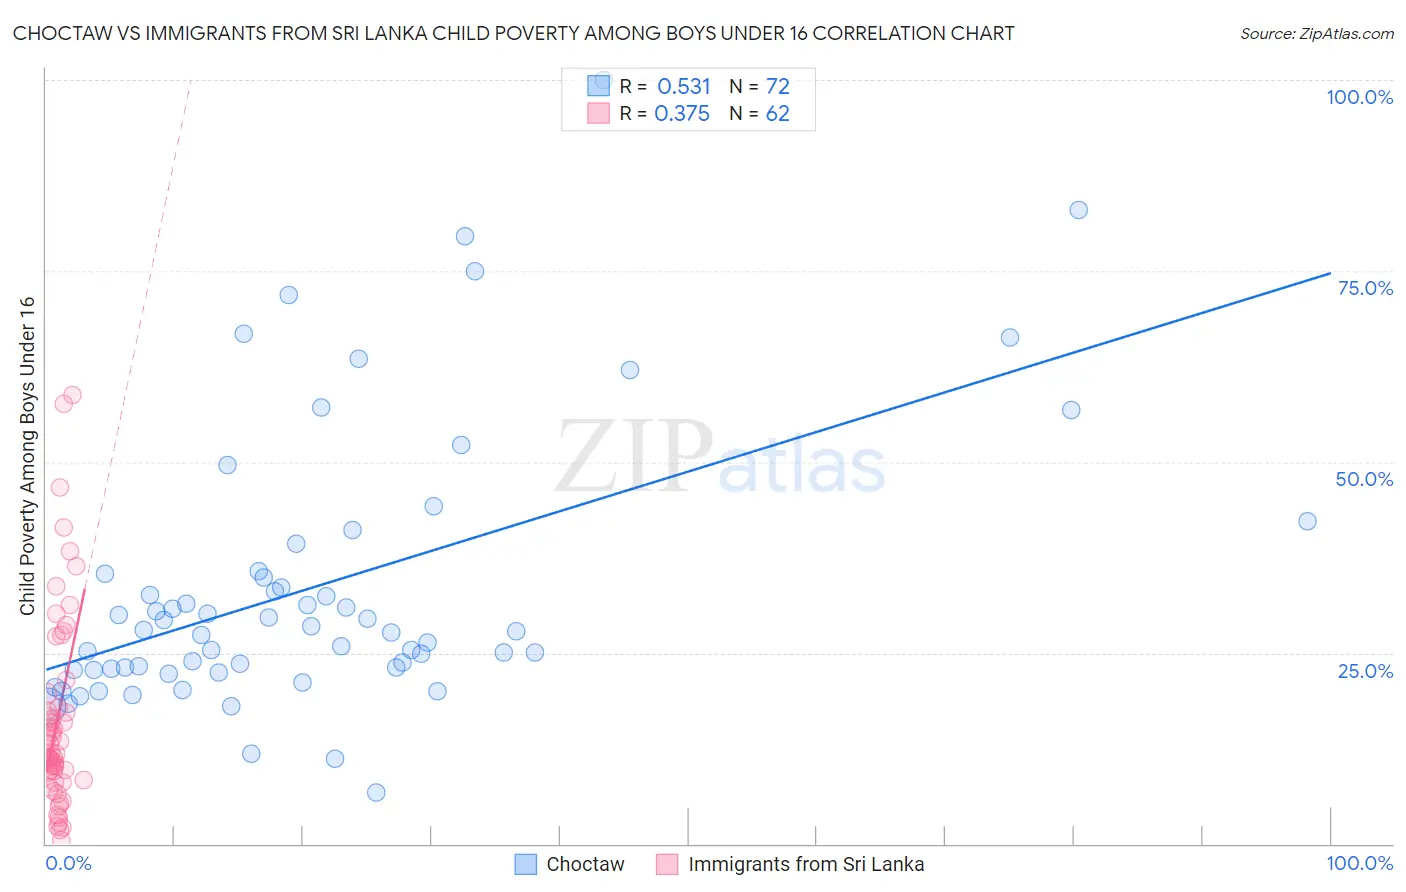
Choctaw vs Immigrants from Sri Lanka Child Poverty Among Boys Under 16 Correlation Chart
The statistical analysis conducted on geographies consisting of 267,402,535 people shows a substantial positive correlation between the proportion of Choctaw and poverty level among boys under the age of 16 in the United States with a correlation coefficient (R) of 0.531 and weighted average of 21.3%. Similarly, the statistical analysis conducted on geographies consisting of 148,658,821 people shows a mild positive correlation between the proportion of Immigrants from Sri Lanka and poverty level among boys under the age of 16 in the United States with a correlation coefficient (R) of 0.375 and weighted average of 13.9%, a difference of 53.8%.
Child Poverty Among Boys Under 16 Correlation Summary
| Measurement | Choctaw | Immigrants from Sri Lanka |
| Minimum | 6.7% | 0.42% |
| Maximum | 100.0% | 58.8% |
| Range | 93.3% | 58.4% |
| Mean | 33.8% | 16.1% |
| Median | 27.9% | 11.5% |
| Interquartile 25% (IQ1) | 22.9% | 8.3% |
| Interquartile 75% (IQ3) | 35.5% | 17.9% |
| Interquartile Range (IQR) | 12.6% | 9.6% |
| Standard Deviation (Sample) | 18.4% | 12.8% |
| Standard Deviation (Population) | 18.2% | 12.7% |
Similar Demographics by Child Poverty Among Boys Under 16
Demographics Similar to Choctaw by Child Poverty Among Boys Under 16
In terms of child poverty among boys under 16, the demographic groups most similar to Choctaw are Immigrants from Grenada (21.3%, a difference of 0.090%), Kiowa (21.3%, a difference of 0.10%), Immigrants from Central America (21.3%, a difference of 0.27%), Immigrants from Haiti (21.3%, a difference of 0.33%), and Immigrants from Mexico (21.5%, a difference of 0.71%).
| Demographics | Rating | Rank | Child Poverty Among Boys Under 16 |
| Haitians | 0.0 /100 | #300 | Tragic 21.0% |
| Guatemalans | 0.0 /100 | #301 | Tragic 21.1% |
| Somalis | 0.0 /100 | #302 | Tragic 21.1% |
| Immigrants | Haiti | 0.0 /100 | #303 | Tragic 21.3% |
| Immigrants | Central America | 0.0 /100 | #304 | Tragic 21.3% |
| Kiowa | 0.0 /100 | #305 | Tragic 21.3% |
| Immigrants | Grenada | 0.0 /100 | #306 | Tragic 21.3% |
| Choctaw | 0.0 /100 | #307 | Tragic 21.3% |
| Immigrants | Mexico | 0.0 /100 | #308 | Tragic 21.5% |
| Seminole | 0.0 /100 | #309 | Tragic 21.5% |
| Creek | 0.0 /100 | #310 | Tragic 21.5% |
| Bahamians | 0.0 /100 | #311 | Tragic 21.6% |
| Immigrants | Guatemala | 0.0 /100 | #312 | Tragic 21.6% |
| British West Indians | 0.0 /100 | #313 | Tragic 21.6% |
| Ute | 0.0 /100 | #314 | Tragic 21.6% |
Demographics Similar to Immigrants from Sri Lanka by Child Poverty Among Boys Under 16
In terms of child poverty among boys under 16, the demographic groups most similar to Immigrants from Sri Lanka are Immigrants from Northern Europe (13.9%, a difference of 0.15%), Immigrants from Australia (13.9%, a difference of 0.28%), Luxembourger (13.8%, a difference of 0.41%), Immigrants from Asia (13.9%, a difference of 0.53%), and Lithuanian (14.0%, a difference of 0.61%).
| Demographics | Rating | Rank | Child Poverty Among Boys Under 16 |
| Swedes | 99.8 /100 | #30 | Exceptional 13.6% |
| Turks | 99.8 /100 | #31 | Exceptional 13.6% |
| Immigrants | China | 99.8 /100 | #32 | Exceptional 13.6% |
| Danes | 99.8 /100 | #33 | Exceptional 13.6% |
| Assyrians/Chaldeans/Syriacs | 99.8 /100 | #34 | Exceptional 13.6% |
| Russians | 99.7 /100 | #35 | Exceptional 13.8% |
| Luxembourgers | 99.7 /100 | #36 | Exceptional 13.8% |
| Immigrants | Sri Lanka | 99.6 /100 | #37 | Exceptional 13.9% |
| Immigrants | Northern Europe | 99.6 /100 | #38 | Exceptional 13.9% |
| Immigrants | Australia | 99.6 /100 | #39 | Exceptional 13.9% |
| Immigrants | Asia | 99.6 /100 | #40 | Exceptional 13.9% |
| Lithuanians | 99.6 /100 | #41 | Exceptional 14.0% |
| Koreans | 99.6 /100 | #42 | Exceptional 14.0% |
| Croatians | 99.5 /100 | #43 | Exceptional 14.0% |
| Estonians | 99.4 /100 | #44 | Exceptional 14.1% |