Choctaw vs Immigrants from Brazil Child Poverty Under the Age of 16
COMPARE
Choctaw
Immigrants from Brazil
Child Poverty Under the Age of 16
Child Poverty Under the Age of 16 Comparison
Choctaw
Immigrants from Brazil
21.0%
CHILD POVERTY UNDER THE AGE OF 16
0.0/ 100
METRIC RATING
303rd/ 347
METRIC RANK
15.1%
CHILD POVERTY UNDER THE AGE OF 16
91.1/ 100
METRIC RATING
123rd/ 347
METRIC RANK
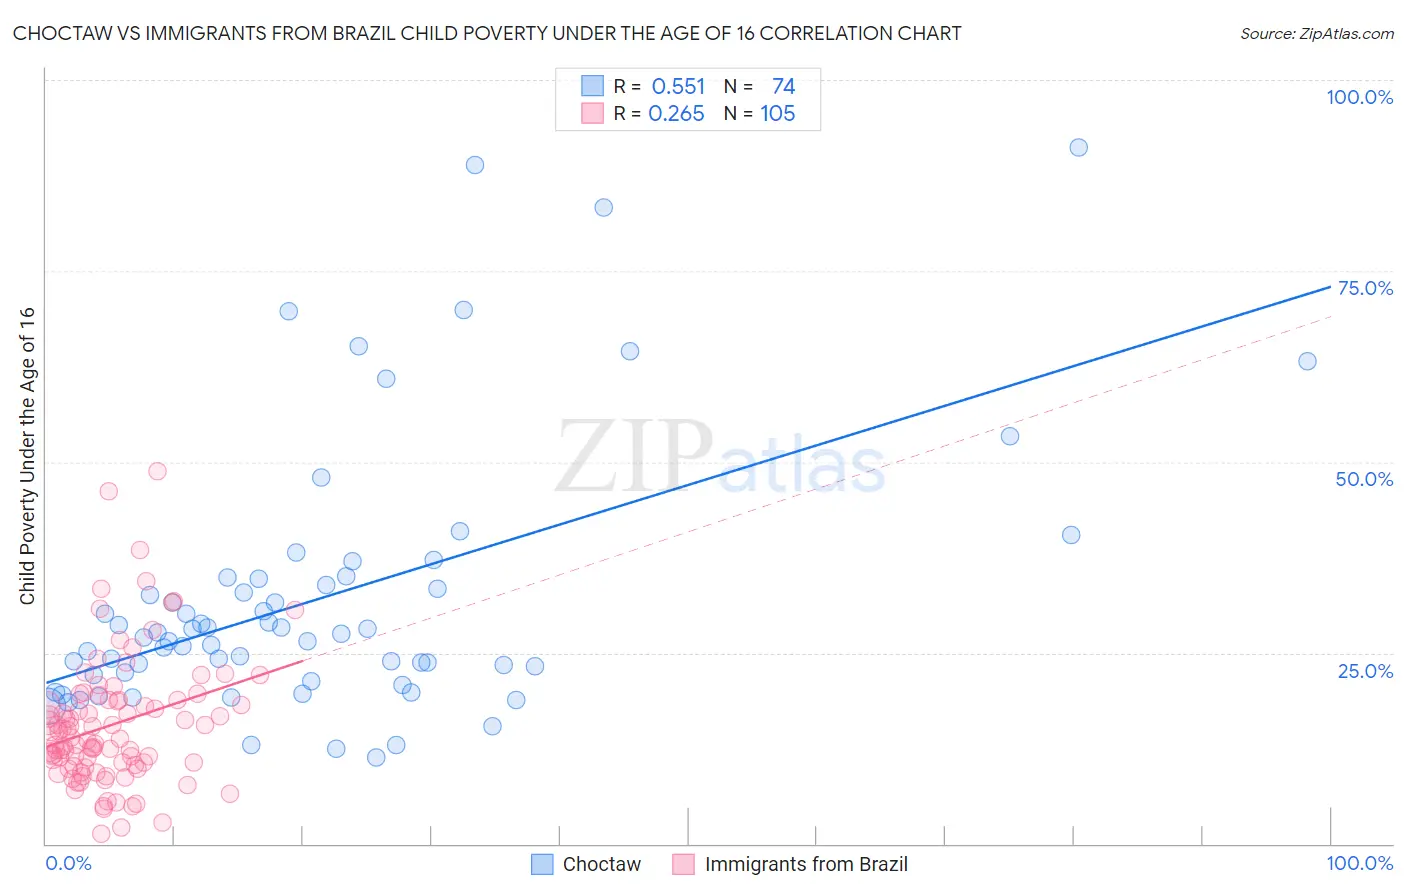
Choctaw vs Immigrants from Brazil Child Poverty Under the Age of 16 Correlation Chart
The statistical analysis conducted on geographies consisting of 268,590,818 people shows a substantial positive correlation between the proportion of Choctaw and poverty level among children under the age of 16 in the United States with a correlation coefficient (R) of 0.551 and weighted average of 21.0%. Similarly, the statistical analysis conducted on geographies consisting of 340,154,943 people shows a weak positive correlation between the proportion of Immigrants from Brazil and poverty level among children under the age of 16 in the United States with a correlation coefficient (R) of 0.265 and weighted average of 15.1%, a difference of 39.5%.
Child Poverty Under the Age of 16 Correlation Summary
| Measurement | Choctaw | Immigrants from Brazil |
| Minimum | 11.4% | 1.4% |
| Maximum | 91.2% | 48.8% |
| Range | 79.9% | 47.4% |
| Mean | 32.2% | 15.6% |
| Median | 27.2% | 13.7% |
| Interquartile 25% (IQ1) | 22.1% | 10.2% |
| Interquartile 75% (IQ3) | 34.7% | 18.8% |
| Interquartile Range (IQR) | 12.6% | 8.6% |
| Standard Deviation (Sample) | 17.5% | 8.5% |
| Standard Deviation (Population) | 17.4% | 8.5% |
Similar Demographics by Child Poverty Under the Age of 16
Demographics Similar to Choctaw by Child Poverty Under the Age of 16
In terms of child poverty under the age of 16, the demographic groups most similar to Choctaw are Immigrants from Bahamas (21.0%, a difference of 0.040%), Somali (21.0%, a difference of 0.050%), Immigrants from Grenada (21.0%, a difference of 0.28%), Indonesian (21.0%, a difference of 0.32%), and Seminole (21.1%, a difference of 0.52%).
| Demographics | Rating | Rank | Child Poverty Under the Age of 16 |
| Immigrants | Caribbean | 0.0 /100 | #296 | Tragic 20.8% |
| Hispanics or Latinos | 0.0 /100 | #297 | Tragic 20.8% |
| Arapaho | 0.0 /100 | #298 | Tragic 20.8% |
| Immigrants | Haiti | 0.0 /100 | #299 | Tragic 20.9% |
| Indonesians | 0.0 /100 | #300 | Tragic 21.0% |
| Immigrants | Grenada | 0.0 /100 | #301 | Tragic 21.0% |
| Immigrants | Bahamas | 0.0 /100 | #302 | Tragic 21.0% |
| Choctaw | 0.0 /100 | #303 | Tragic 21.0% |
| Somalis | 0.0 /100 | #304 | Tragic 21.0% |
| Seminole | 0.0 /100 | #305 | Tragic 21.1% |
| Guatemalans | 0.0 /100 | #306 | Tragic 21.2% |
| Immigrants | Central America | 0.0 /100 | #307 | Tragic 21.3% |
| British West Indians | 0.0 /100 | #308 | Tragic 21.3% |
| Immigrants | Mexico | 0.0 /100 | #309 | Tragic 21.5% |
| Bahamians | 0.0 /100 | #310 | Tragic 21.5% |
Demographics Similar to Immigrants from Brazil by Child Poverty Under the Age of 16
In terms of child poverty under the age of 16, the demographic groups most similar to Immigrants from Brazil are Czechoslovakian (15.1%, a difference of 0.0%), Palestinian (15.1%, a difference of 0.040%), Portuguese (15.1%, a difference of 0.19%), Pakistani (15.0%, a difference of 0.24%), and Immigrants from Western Europe (15.1%, a difference of 0.28%).
| Demographics | Rating | Rank | Child Poverty Under the Age of 16 |
| Carpatho Rusyns | 93.1 /100 | #116 | Exceptional 14.9% |
| Immigrants | Norway | 92.8 /100 | #117 | Exceptional 15.0% |
| Immigrants | Malaysia | 92.6 /100 | #118 | Exceptional 15.0% |
| Scottish | 92.3 /100 | #119 | Exceptional 15.0% |
| South Africans | 92.1 /100 | #120 | Exceptional 15.0% |
| Immigrants | Zimbabwe | 92.1 /100 | #121 | Exceptional 15.0% |
| Pakistanis | 91.7 /100 | #122 | Exceptional 15.0% |
| Immigrants | Brazil | 91.1 /100 | #123 | Exceptional 15.1% |
| Czechoslovakians | 91.0 /100 | #124 | Exceptional 15.1% |
| Palestinians | 90.9 /100 | #125 | Exceptional 15.1% |
| Portuguese | 90.6 /100 | #126 | Exceptional 15.1% |
| Immigrants | Western Europe | 90.3 /100 | #127 | Exceptional 15.1% |
| Immigrants | Kazakhstan | 90.2 /100 | #128 | Exceptional 15.1% |
| Immigrants | Southern Europe | 89.7 /100 | #129 | Excellent 15.1% |
| Mongolians | 89.5 /100 | #130 | Excellent 15.2% |