Choctaw vs Immigrants from Egypt Child Poverty Under the Age of 16
COMPARE
Choctaw
Immigrants from Egypt
Child Poverty Under the Age of 16
Child Poverty Under the Age of 16 Comparison
Choctaw
Immigrants from Egypt
21.0%
CHILD POVERTY UNDER THE AGE OF 16
0.0/ 100
METRIC RATING
303rd/ 347
METRIC RANK
14.8%
CHILD POVERTY UNDER THE AGE OF 16
94.9/ 100
METRIC RATING
103rd/ 347
METRIC RANK
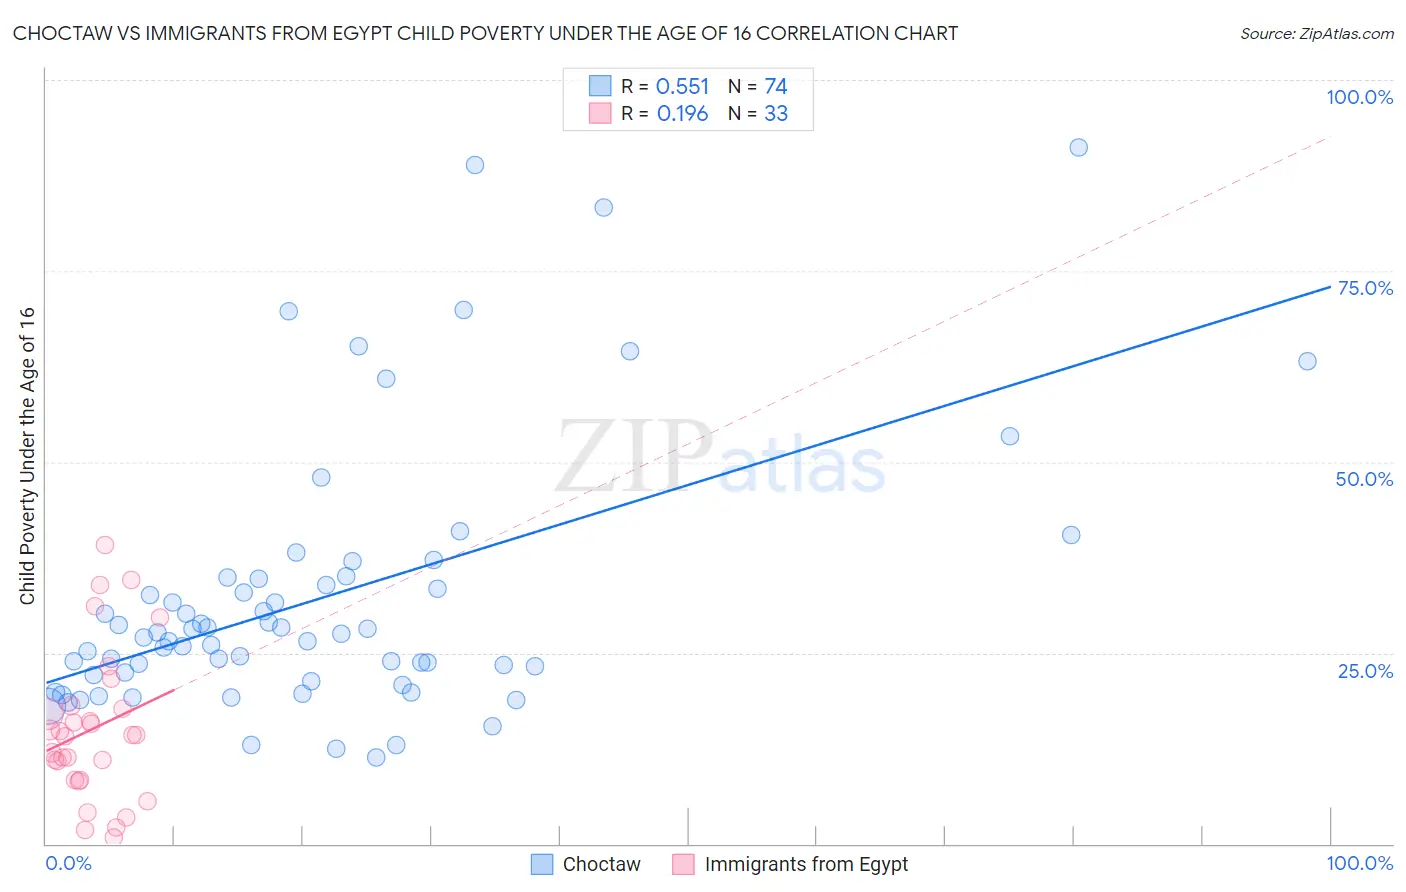
Choctaw vs Immigrants from Egypt Child Poverty Under the Age of 16 Correlation Chart
The statistical analysis conducted on geographies consisting of 268,590,818 people shows a substantial positive correlation between the proportion of Choctaw and poverty level among children under the age of 16 in the United States with a correlation coefficient (R) of 0.551 and weighted average of 21.0%. Similarly, the statistical analysis conducted on geographies consisting of 244,047,631 people shows a poor positive correlation between the proportion of Immigrants from Egypt and poverty level among children under the age of 16 in the United States with a correlation coefficient (R) of 0.196 and weighted average of 14.8%, a difference of 42.2%.
Child Poverty Under the Age of 16 Correlation Summary
| Measurement | Choctaw | Immigrants from Egypt |
| Minimum | 11.4% | 0.84% |
| Maximum | 91.2% | 39.1% |
| Range | 79.9% | 38.3% |
| Mean | 32.2% | 15.0% |
| Median | 27.2% | 14.3% |
| Interquartile 25% (IQ1) | 22.1% | 8.4% |
| Interquartile 75% (IQ3) | 34.7% | 17.9% |
| Interquartile Range (IQR) | 12.6% | 9.5% |
| Standard Deviation (Sample) | 17.5% | 9.7% |
| Standard Deviation (Population) | 17.4% | 9.6% |
Similar Demographics by Child Poverty Under the Age of 16
Demographics Similar to Choctaw by Child Poverty Under the Age of 16
In terms of child poverty under the age of 16, the demographic groups most similar to Choctaw are Immigrants from Bahamas (21.0%, a difference of 0.040%), Somali (21.0%, a difference of 0.050%), Immigrants from Grenada (21.0%, a difference of 0.28%), Indonesian (21.0%, a difference of 0.32%), and Seminole (21.1%, a difference of 0.52%).
| Demographics | Rating | Rank | Child Poverty Under the Age of 16 |
| Immigrants | Caribbean | 0.0 /100 | #296 | Tragic 20.8% |
| Hispanics or Latinos | 0.0 /100 | #297 | Tragic 20.8% |
| Arapaho | 0.0 /100 | #298 | Tragic 20.8% |
| Immigrants | Haiti | 0.0 /100 | #299 | Tragic 20.9% |
| Indonesians | 0.0 /100 | #300 | Tragic 21.0% |
| Immigrants | Grenada | 0.0 /100 | #301 | Tragic 21.0% |
| Immigrants | Bahamas | 0.0 /100 | #302 | Tragic 21.0% |
| Choctaw | 0.0 /100 | #303 | Tragic 21.0% |
| Somalis | 0.0 /100 | #304 | Tragic 21.0% |
| Seminole | 0.0 /100 | #305 | Tragic 21.1% |
| Guatemalans | 0.0 /100 | #306 | Tragic 21.2% |
| Immigrants | Central America | 0.0 /100 | #307 | Tragic 21.3% |
| British West Indians | 0.0 /100 | #308 | Tragic 21.3% |
| Immigrants | Mexico | 0.0 /100 | #309 | Tragic 21.5% |
| Bahamians | 0.0 /100 | #310 | Tragic 21.5% |
Demographics Similar to Immigrants from Egypt by Child Poverty Under the Age of 16
In terms of child poverty under the age of 16, the demographic groups most similar to Immigrants from Egypt are Immigrants from England (14.8%, a difference of 0.040%), Romanian (14.8%, a difference of 0.050%), Immigrants from Switzerland (14.8%, a difference of 0.11%), Dutch (14.8%, a difference of 0.13%), and Basque (14.8%, a difference of 0.15%).
| Demographics | Rating | Rank | Child Poverty Under the Age of 16 |
| Immigrants | France | 95.8 /100 | #96 | Exceptional 14.7% |
| Paraguayans | 95.7 /100 | #97 | Exceptional 14.7% |
| Immigrants | Belarus | 95.7 /100 | #98 | Exceptional 14.7% |
| British | 95.5 /100 | #99 | Exceptional 14.7% |
| Dutch | 95.1 /100 | #100 | Exceptional 14.8% |
| Immigrants | Switzerland | 95.1 /100 | #101 | Exceptional 14.8% |
| Romanians | 95.0 /100 | #102 | Exceptional 14.8% |
| Immigrants | Egypt | 94.9 /100 | #103 | Exceptional 14.8% |
| Immigrants | England | 94.8 /100 | #104 | Exceptional 14.8% |
| Basques | 94.7 /100 | #105 | Exceptional 14.8% |
| Serbians | 94.5 /100 | #106 | Exceptional 14.8% |
| Chileans | 94.4 /100 | #107 | Exceptional 14.8% |
| Jordanians | 94.2 /100 | #108 | Exceptional 14.8% |
| Tlingit-Haida | 94.1 /100 | #109 | Exceptional 14.9% |
| English | 93.5 /100 | #110 | Exceptional 14.9% |