Immigrants from England vs Honduran Female Poverty
COMPARE
Immigrants from England
Honduran
Female Poverty
Female Poverty Comparison
Immigrants from England
Hondurans
12.3%
FEMALE POVERTY
96.9/ 100
METRIC RATING
83rd/ 347
METRIC RANK
17.4%
FEMALE POVERTY
0.0/ 100
METRIC RATING
316th/ 347
METRIC RANK
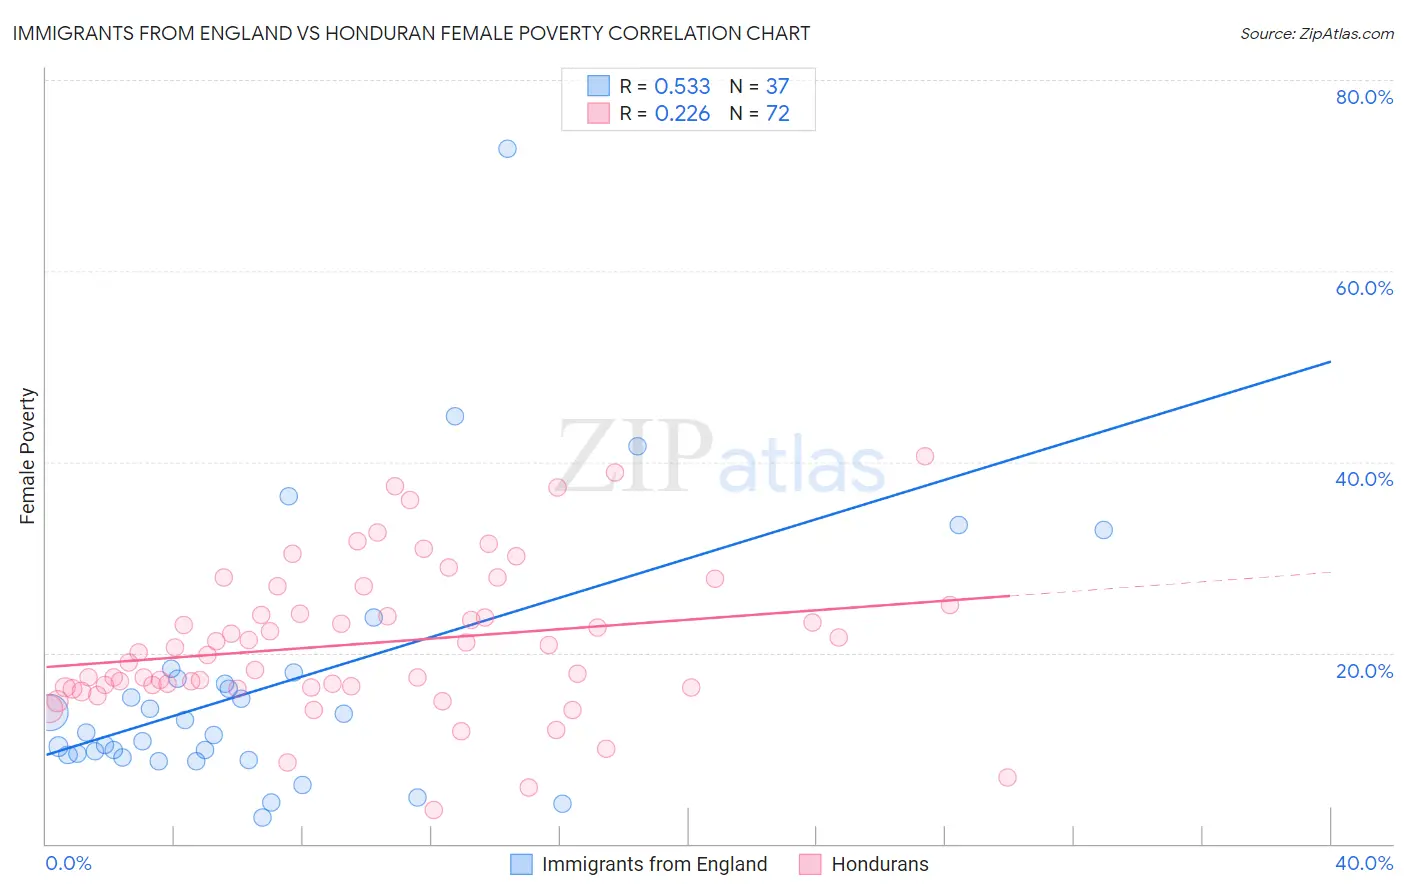
Immigrants from England vs Honduran Female Poverty Correlation Chart
The statistical analysis conducted on geographies consisting of 391,675,853 people shows a substantial positive correlation between the proportion of Immigrants from England and poverty level among females in the United States with a correlation coefficient (R) of 0.533 and weighted average of 12.3%. Similarly, the statistical analysis conducted on geographies consisting of 357,544,045 people shows a weak positive correlation between the proportion of Hondurans and poverty level among females in the United States with a correlation coefficient (R) of 0.226 and weighted average of 17.4%, a difference of 40.8%.
Female Poverty Correlation Summary
| Measurement | Immigrants from England | Honduran |
| Minimum | 2.7% | 3.6% |
| Maximum | 72.8% | 40.6% |
| Range | 70.1% | 37.0% |
| Mean | 16.7% | 21.0% |
| Median | 11.6% | 20.0% |
| Interquartile 25% (IQ1) | 9.2% | 16.4% |
| Interquartile 75% (IQ3) | 17.6% | 24.5% |
| Interquartile Range (IQR) | 8.4% | 8.1% |
| Standard Deviation (Sample) | 13.9% | 7.7% |
| Standard Deviation (Population) | 13.8% | 7.7% |
Similar Demographics by Female Poverty
Demographics Similar to Immigrants from England by Female Poverty
In terms of female poverty, the demographic groups most similar to Immigrants from England are Jordanian (12.3%, a difference of 0.18%), Slovak (12.3%, a difference of 0.19%), Immigrants from Sweden (12.3%, a difference of 0.19%), Northern European (12.4%, a difference of 0.23%), and Immigrants from North America (12.3%, a difference of 0.24%).
| Demographics | Rating | Rank | Female Poverty |
| Immigrants | Eastern Europe | 97.2 /100 | #76 | Exceptional 12.3% |
| Serbians | 97.2 /100 | #77 | Exceptional 12.3% |
| Egyptians | 97.2 /100 | #78 | Exceptional 12.3% |
| Immigrants | North America | 97.1 /100 | #79 | Exceptional 12.3% |
| Slovaks | 97.1 /100 | #80 | Exceptional 12.3% |
| Immigrants | Sweden | 97.1 /100 | #81 | Exceptional 12.3% |
| Jordanians | 97.1 /100 | #82 | Exceptional 12.3% |
| Immigrants | England | 96.9 /100 | #83 | Exceptional 12.3% |
| Northern Europeans | 96.6 /100 | #84 | Exceptional 12.4% |
| Irish | 96.5 /100 | #85 | Exceptional 12.4% |
| Dutch | 96.5 /100 | #86 | Exceptional 12.4% |
| Okinawans | 96.4 /100 | #87 | Exceptional 12.4% |
| Finns | 96.4 /100 | #88 | Exceptional 12.4% |
| English | 96.1 /100 | #89 | Exceptional 12.4% |
| Immigrants | Denmark | 95.8 /100 | #90 | Exceptional 12.4% |
Demographics Similar to Hondurans by Female Poverty
In terms of female poverty, the demographic groups most similar to Hondurans are Immigrants from Congo (17.4%, a difference of 0.19%), U.S. Virgin Islander (17.3%, a difference of 0.30%), Ute (17.5%, a difference of 0.52%), Cajun (17.5%, a difference of 0.53%), and Immigrants from Dominica (17.5%, a difference of 0.61%).
| Demographics | Rating | Rank | Female Poverty |
| Immigrants | Mexico | 0.0 /100 | #309 | Tragic 17.0% |
| Creek | 0.0 /100 | #310 | Tragic 17.0% |
| Immigrants | Guatemala | 0.0 /100 | #311 | Tragic 17.0% |
| Immigrants | Somalia | 0.0 /100 | #312 | Tragic 17.0% |
| British West Indians | 0.0 /100 | #313 | Tragic 17.0% |
| Dutch West Indians | 0.0 /100 | #314 | Tragic 17.1% |
| U.S. Virgin Islanders | 0.0 /100 | #315 | Tragic 17.3% |
| Hondurans | 0.0 /100 | #316 | Tragic 17.4% |
| Immigrants | Congo | 0.0 /100 | #317 | Tragic 17.4% |
| Ute | 0.0 /100 | #318 | Tragic 17.5% |
| Cajuns | 0.0 /100 | #319 | Tragic 17.5% |
| Immigrants | Dominica | 0.0 /100 | #320 | Tragic 17.5% |
| Arapaho | 0.0 /100 | #321 | Tragic 17.5% |
| Menominee | 0.0 /100 | #322 | Tragic 17.6% |
| Paiute | 0.0 /100 | #323 | Tragic 17.7% |