Chippewa vs Immigrants from Albania Child Poverty Among Boys Under 16
COMPARE
Chippewa
Immigrants from Albania
Child Poverty Among Boys Under 16
Child Poverty Among Boys Under 16 Comparison
Chippewa
Immigrants from Albania
21.0%
CHILD POVERTY AMONG BOYS UNDER 16
0.0/ 100
METRIC RATING
298th/ 347
METRIC RANK
16.1%
CHILD POVERTY AMONG BOYS UNDER 16
67.9/ 100
METRIC RATING
164th/ 347
METRIC RANK
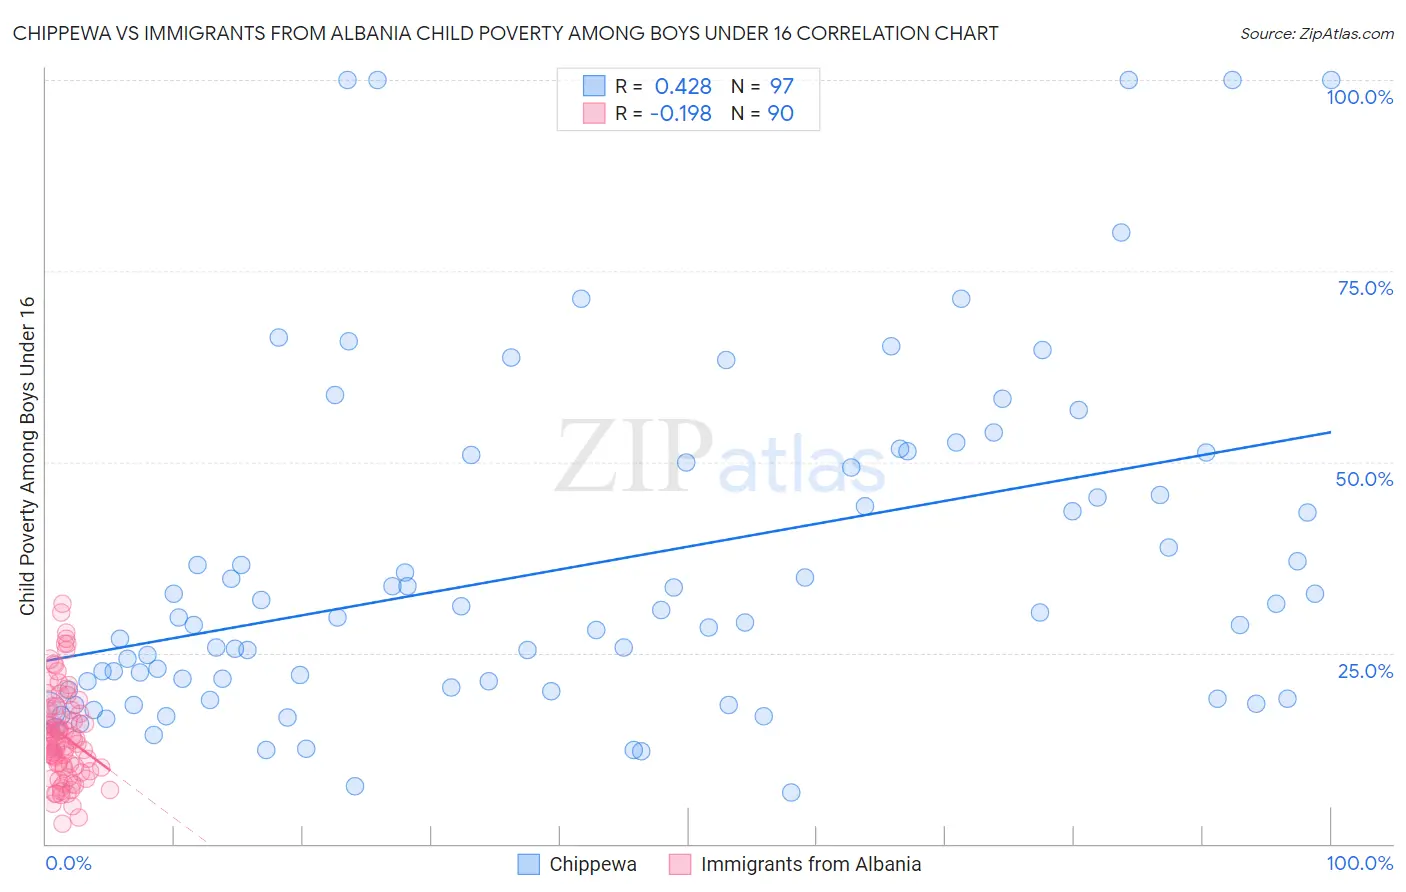
Chippewa vs Immigrants from Albania Child Poverty Among Boys Under 16 Correlation Chart
The statistical analysis conducted on geographies consisting of 213,098,717 people shows a moderate positive correlation between the proportion of Chippewa and poverty level among boys under the age of 16 in the United States with a correlation coefficient (R) of 0.428 and weighted average of 21.0%. Similarly, the statistical analysis conducted on geographies consisting of 118,372,519 people shows a poor negative correlation between the proportion of Immigrants from Albania and poverty level among boys under the age of 16 in the United States with a correlation coefficient (R) of -0.198 and weighted average of 16.1%, a difference of 30.3%.
Child Poverty Among Boys Under 16 Correlation Summary
| Measurement | Chippewa | Immigrants from Albania |
| Minimum | 6.7% | 2.7% |
| Maximum | 100.0% | 31.4% |
| Range | 93.3% | 28.7% |
| Mean | 36.2% | 14.2% |
| Median | 29.7% | 13.2% |
| Interquartile 25% (IQ1) | 20.1% | 9.9% |
| Interquartile 75% (IQ3) | 49.6% | 17.5% |
| Interquartile Range (IQR) | 29.5% | 7.5% |
| Standard Deviation (Sample) | 22.2% | 6.1% |
| Standard Deviation (Population) | 22.1% | 6.1% |
Similar Demographics by Child Poverty Among Boys Under 16
Demographics Similar to Chippewa by Child Poverty Among Boys Under 16
In terms of child poverty among boys under 16, the demographic groups most similar to Chippewa are Hispanic or Latino (20.9%, a difference of 0.26%), Immigrants from Caribbean (21.0%, a difference of 0.27%), Haitian (21.0%, a difference of 0.32%), Indonesian (20.8%, a difference of 0.86%), and Guatemalan (21.1%, a difference of 0.86%).
| Demographics | Rating | Rank | Child Poverty Among Boys Under 16 |
| Immigrants | Latin America | 0.0 /100 | #291 | Tragic 20.6% |
| Yaqui | 0.0 /100 | #292 | Tragic 20.7% |
| Immigrants | Senegal | 0.0 /100 | #293 | Tragic 20.7% |
| Immigrants | Bahamas | 0.0 /100 | #294 | Tragic 20.7% |
| Mexicans | 0.0 /100 | #295 | Tragic 20.7% |
| Indonesians | 0.0 /100 | #296 | Tragic 20.8% |
| Hispanics or Latinos | 0.0 /100 | #297 | Tragic 20.9% |
| Chippewa | 0.0 /100 | #298 | Tragic 21.0% |
| Immigrants | Caribbean | 0.0 /100 | #299 | Tragic 21.0% |
| Haitians | 0.0 /100 | #300 | Tragic 21.0% |
| Guatemalans | 0.0 /100 | #301 | Tragic 21.1% |
| Somalis | 0.0 /100 | #302 | Tragic 21.1% |
| Immigrants | Haiti | 0.0 /100 | #303 | Tragic 21.3% |
| Immigrants | Central America | 0.0 /100 | #304 | Tragic 21.3% |
| Kiowa | 0.0 /100 | #305 | Tragic 21.3% |
Demographics Similar to Immigrants from Albania by Child Poverty Among Boys Under 16
In terms of child poverty among boys under 16, the demographic groups most similar to Immigrants from Albania are Costa Rican (16.1%, a difference of 0.020%), Guamanian/Chamorro (16.1%, a difference of 0.22%), Colombian (16.1%, a difference of 0.35%), Immigrants from Oceania (16.0%, a difference of 0.45%), and Immigrants from Northern Africa (16.0%, a difference of 0.46%).
| Demographics | Rating | Rank | Child Poverty Among Boys Under 16 |
| Immigrants | Nepal | 76.0 /100 | #157 | Good 15.9% |
| Yugoslavians | 75.9 /100 | #158 | Good 15.9% |
| Immigrants | Chile | 74.8 /100 | #159 | Good 15.9% |
| Immigrants | Northern Africa | 71.3 /100 | #160 | Good 16.0% |
| Immigrants | Oceania | 71.3 /100 | #161 | Good 16.0% |
| Guamanians/Chamorros | 69.6 /100 | #162 | Good 16.1% |
| Costa Ricans | 68.1 /100 | #163 | Good 16.1% |
| Immigrants | Albania | 67.9 /100 | #164 | Good 16.1% |
| Colombians | 65.2 /100 | #165 | Good 16.1% |
| Immigrants | Germany | 63.6 /100 | #166 | Good 16.2% |
| Afghans | 55.4 /100 | #167 | Average 16.3% |
| South Americans | 55.3 /100 | #168 | Average 16.3% |
| Immigrants | Saudi Arabia | 53.6 /100 | #169 | Average 16.4% |
| Immigrants | Bosnia and Herzegovina | 51.7 /100 | #170 | Average 16.4% |
| Immigrants | Ethiopia | 51.3 /100 | #171 | Average 16.4% |