Cheyenne vs Immigrants from Sri Lanka Poverty
COMPARE
Cheyenne
Immigrants from Sri Lanka
Poverty
Poverty Comparison
Cheyenne
Immigrants from Sri Lanka
18.9%
POVERTY
0.0/ 100
METRIC RATING
335th/ 347
METRIC RANK
11.2%
POVERTY
97.9/ 100
METRIC RATING
60th/ 347
METRIC RANK
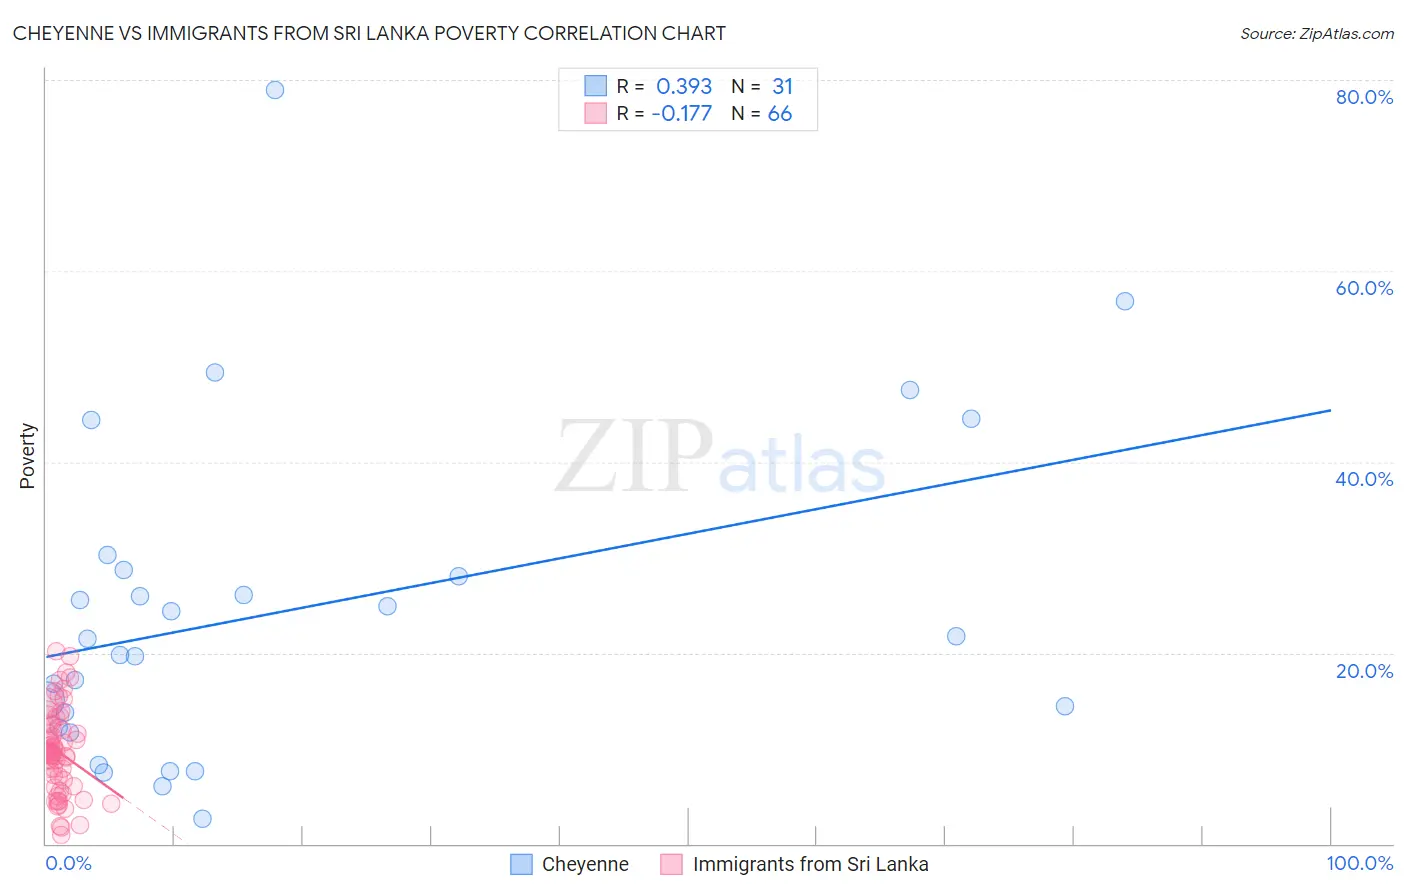
Cheyenne vs Immigrants from Sri Lanka Poverty Correlation Chart
The statistical analysis conducted on geographies consisting of 80,711,437 people shows a mild positive correlation between the proportion of Cheyenne and poverty level in the United States with a correlation coefficient (R) of 0.393 and weighted average of 18.9%. Similarly, the statistical analysis conducted on geographies consisting of 149,683,532 people shows a poor negative correlation between the proportion of Immigrants from Sri Lanka and poverty level in the United States with a correlation coefficient (R) of -0.177 and weighted average of 11.2%, a difference of 69.6%.
Poverty Correlation Summary
| Measurement | Cheyenne | Immigrants from Sri Lanka |
| Minimum | 2.7% | 0.89% |
| Maximum | 78.9% | 20.2% |
| Range | 76.3% | 19.3% |
| Mean | 24.5% | 9.6% |
| Median | 21.4% | 9.6% |
| Interquartile 25% (IQ1) | 12.2% | 6.0% |
| Interquartile 75% (IQ3) | 28.6% | 12.4% |
| Interquartile Range (IQR) | 16.5% | 6.4% |
| Standard Deviation (Sample) | 17.1% | 4.5% |
| Standard Deviation (Population) | 16.8% | 4.4% |
Similar Demographics by Poverty
Demographics Similar to Cheyenne by Poverty
In terms of poverty, the demographic groups most similar to Cheyenne are Pueblo (19.4%, a difference of 2.5%), Apache (18.4%, a difference of 2.8%), Houma (18.4%, a difference of 2.8%), Sioux (19.8%, a difference of 4.4%), and Native/Alaskan (18.1%, a difference of 4.9%).
| Demographics | Rating | Rank | Poverty |
| Ute | 0.0 /100 | #328 | Tragic 16.9% |
| Blacks/African Americans | 0.0 /100 | #329 | Tragic 17.3% |
| Dominicans | 0.0 /100 | #330 | Tragic 17.6% |
| Immigrants | Dominican Republic | 0.0 /100 | #331 | Tragic 17.8% |
| Natives/Alaskans | 0.0 /100 | #332 | Tragic 18.1% |
| Houma | 0.0 /100 | #333 | Tragic 18.4% |
| Apache | 0.0 /100 | #334 | Tragic 18.4% |
| Cheyenne | 0.0 /100 | #335 | Tragic 18.9% |
| Pueblo | 0.0 /100 | #336 | Tragic 19.4% |
| Sioux | 0.0 /100 | #337 | Tragic 19.8% |
| Yuman | 0.0 /100 | #338 | Tragic 20.2% |
| Crow | 0.0 /100 | #339 | Tragic 20.7% |
| Yup'ik | 0.0 /100 | #340 | Tragic 20.8% |
| Hopi | 0.0 /100 | #341 | Tragic 20.8% |
| Immigrants | Yemen | 0.0 /100 | #342 | Tragic 21.5% |
Demographics Similar to Immigrants from Sri Lanka by Poverty
In terms of poverty, the demographic groups most similar to Immigrants from Sri Lanka are Immigrants from Italy (11.2%, a difference of 0.060%), Austrian (11.2%, a difference of 0.10%), Ukrainian (11.2%, a difference of 0.10%), Immigrants from Europe (11.2%, a difference of 0.16%), and German (11.1%, a difference of 0.31%).
| Demographics | Rating | Rank | Poverty |
| Immigrants | Austria | 98.6 /100 | #53 | Exceptional 11.1% |
| Immigrants | Bulgaria | 98.5 /100 | #54 | Exceptional 11.1% |
| Immigrants | Serbia | 98.5 /100 | #55 | Exceptional 11.1% |
| Estonians | 98.2 /100 | #56 | Exceptional 11.1% |
| Scandinavians | 98.2 /100 | #57 | Exceptional 11.1% |
| Germans | 98.1 /100 | #58 | Exceptional 11.1% |
| Immigrants | Europe | 98.0 /100 | #59 | Exceptional 11.2% |
| Immigrants | Sri Lanka | 97.9 /100 | #60 | Exceptional 11.2% |
| Immigrants | Italy | 97.9 /100 | #61 | Exceptional 11.2% |
| Austrians | 97.8 /100 | #62 | Exceptional 11.2% |
| Ukrainians | 97.8 /100 | #63 | Exceptional 11.2% |
| Swiss | 97.7 /100 | #64 | Exceptional 11.2% |
| Immigrants | Asia | 97.5 /100 | #65 | Exceptional 11.2% |
| Immigrants | Netherlands | 97.5 /100 | #66 | Exceptional 11.2% |
| Immigrants | Australia | 97.4 /100 | #67 | Exceptional 11.2% |