Cheyenne vs Immigrants from Sri Lanka 10th Grade
COMPARE
Cheyenne
Immigrants from Sri Lanka
10th Grade
10th Grade Comparison
Cheyenne
Immigrants from Sri Lanka
93.5%
10TH GRADE
26.8/ 100
METRIC RATING
195th/ 347
METRIC RANK
94.2%
10TH GRADE
89.9/ 100
METRIC RATING
138th/ 347
METRIC RANK
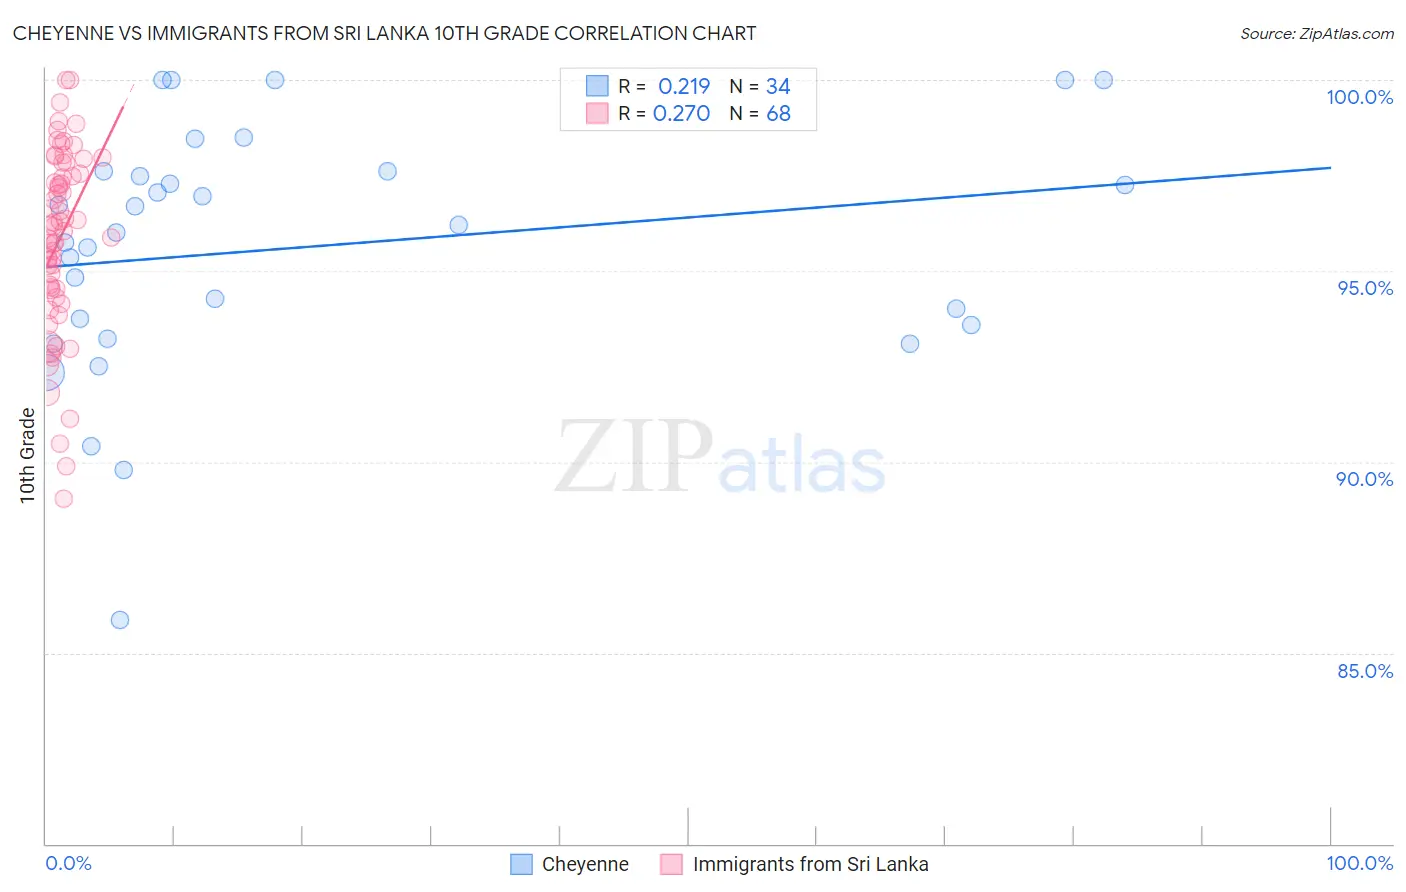
Cheyenne vs Immigrants from Sri Lanka 10th Grade Correlation Chart
The statistical analysis conducted on geographies consisting of 80,719,411 people shows a weak positive correlation between the proportion of Cheyenne and percentage of population with at least 10th grade education in the United States with a correlation coefficient (R) of 0.219 and weighted average of 93.5%. Similarly, the statistical analysis conducted on geographies consisting of 149,660,761 people shows a weak positive correlation between the proportion of Immigrants from Sri Lanka and percentage of population with at least 10th grade education in the United States with a correlation coefficient (R) of 0.270 and weighted average of 94.2%, a difference of 0.72%.
10th Grade Correlation Summary
| Measurement | Cheyenne | Immigrants from Sri Lanka |
| Minimum | 85.8% | 89.0% |
| Maximum | 100.0% | 100.0% |
| Range | 14.2% | 11.0% |
| Mean | 95.6% | 95.8% |
| Median | 96.1% | 96.2% |
| Interquartile 25% (IQ1) | 93.6% | 94.5% |
| Interquartile 75% (IQ3) | 97.6% | 97.7% |
| Interquartile Range (IQR) | 4.0% | 3.2% |
| Standard Deviation (Sample) | 3.2% | 2.4% |
| Standard Deviation (Population) | 3.2% | 2.4% |
Similar Demographics by 10th Grade
Demographics Similar to Cheyenne by 10th Grade
In terms of 10th grade, the demographic groups most similar to Cheyenne are Immigrants from Morocco (93.5%, a difference of 0.0%), Immigrants from Malaysia (93.5%, a difference of 0.010%), Panamanian (93.5%, a difference of 0.010%), Moroccan (93.5%, a difference of 0.020%), and Pueblo (93.5%, a difference of 0.030%).
| Demographics | Rating | Rank | 10th Grade |
| Marshallese | 33.2 /100 | #188 | Fair 93.6% |
| Immigrants | Pakistan | 32.5 /100 | #189 | Fair 93.6% |
| Laotians | 32.1 /100 | #190 | Fair 93.6% |
| Yup'ik | 31.1 /100 | #191 | Fair 93.6% |
| Immigrants | Malaysia | 28.0 /100 | #192 | Fair 93.5% |
| Panamanians | 28.0 /100 | #193 | Fair 93.5% |
| Immigrants | Morocco | 26.9 /100 | #194 | Fair 93.5% |
| Cheyenne | 26.8 /100 | #195 | Fair 93.5% |
| Moroccans | 25.3 /100 | #196 | Fair 93.5% |
| Pueblo | 23.9 /100 | #197 | Fair 93.5% |
| Immigrants | Micronesia | 23.2 /100 | #198 | Fair 93.5% |
| Asians | 23.0 /100 | #199 | Fair 93.5% |
| Hopi | 22.2 /100 | #200 | Fair 93.5% |
| Hawaiians | 21.8 /100 | #201 | Fair 93.5% |
| Immigrants | Uganda | 20.9 /100 | #202 | Fair 93.5% |
Demographics Similar to Immigrants from Sri Lanka by 10th Grade
In terms of 10th grade, the demographic groups most similar to Immigrants from Sri Lanka are Arapaho (94.2%, a difference of 0.010%), Immigrants from Bosnia and Herzegovina (94.2%, a difference of 0.010%), Shoshone (94.2%, a difference of 0.020%), Immigrants from Korea (94.2%, a difference of 0.040%), and Creek (94.2%, a difference of 0.050%).
| Demographics | Rating | Rank | 10th Grade |
| Immigrants | Eastern Europe | 92.5 /100 | #131 | Exceptional 94.3% |
| Immigrants | Russia | 92.4 /100 | #132 | Exceptional 94.3% |
| Creek | 91.9 /100 | #133 | Exceptional 94.2% |
| Osage | 91.7 /100 | #134 | Exceptional 94.2% |
| Immigrants | Korea | 91.3 /100 | #135 | Exceptional 94.2% |
| Shoshone | 90.8 /100 | #136 | Exceptional 94.2% |
| Arapaho | 90.5 /100 | #137 | Exceptional 94.2% |
| Immigrants | Sri Lanka | 89.9 /100 | #138 | Excellent 94.2% |
| Immigrants | Bosnia and Herzegovina | 89.4 /100 | #139 | Excellent 94.2% |
| Immigrants | Jordan | 87.6 /100 | #140 | Excellent 94.1% |
| Hmong | 86.6 /100 | #141 | Excellent 94.1% |
| Albanians | 86.5 /100 | #142 | Excellent 94.1% |
| Cherokee | 84.9 /100 | #143 | Excellent 94.1% |
| Immigrants | Kazakhstan | 84.9 /100 | #144 | Excellent 94.1% |
| Immigrants | Nonimmigrants | 83.8 /100 | #145 | Excellent 94.1% |