Cheyenne vs Immigrants from South Africa Seniors Poverty Over the Age of 75
COMPARE
Cheyenne
Immigrants from South Africa
Seniors Poverty Over the Age of 75
Seniors Poverty Over the Age of 75 Comparison
Cheyenne
Immigrants from South Africa
14.9%
SENIORS POVERTY OVER THE AGE OF 75
0.0/ 100
METRIC RATING
284th/ 347
METRIC RANK
11.5%
SENIORS POVERTY OVER THE AGE OF 75
94.9/ 100
METRIC RATING
83rd/ 347
METRIC RANK
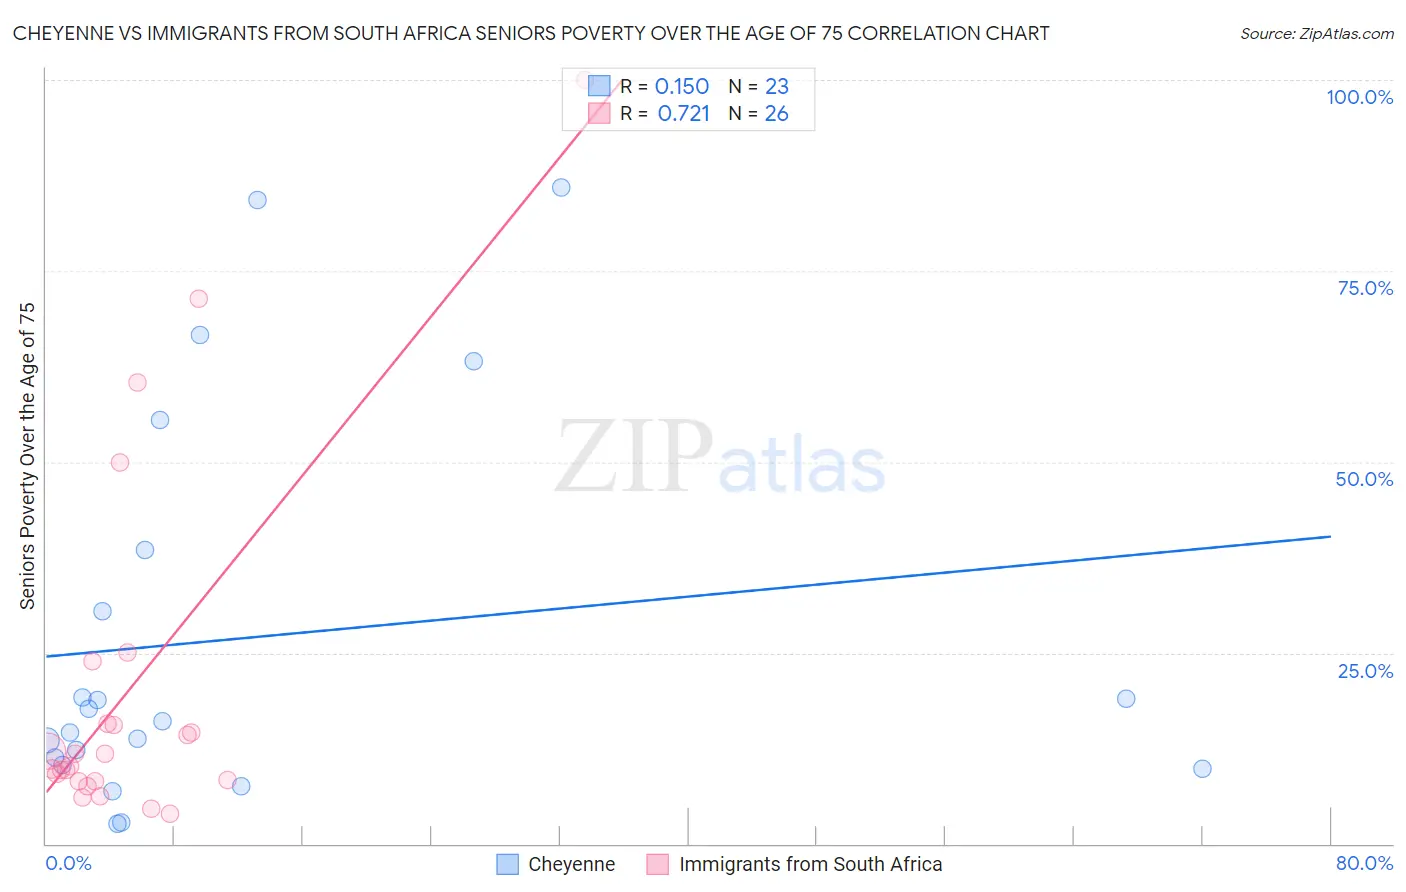
Cheyenne vs Immigrants from South Africa Seniors Poverty Over the Age of 75 Correlation Chart
The statistical analysis conducted on geographies consisting of 80,378,238 people shows a poor positive correlation between the proportion of Cheyenne and poverty level among seniors over the age of 75 in the United States with a correlation coefficient (R) of 0.150 and weighted average of 14.9%. Similarly, the statistical analysis conducted on geographies consisting of 231,486,555 people shows a strong positive correlation between the proportion of Immigrants from South Africa and poverty level among seniors over the age of 75 in the United States with a correlation coefficient (R) of 0.721 and weighted average of 11.5%, a difference of 29.8%.
Seniors Poverty Over the Age of 75 Correlation Summary
| Measurement | Cheyenne | Immigrants from South Africa |
| Minimum | 2.7% | 4.0% |
| Maximum | 85.9% | 100.0% |
| Range | 83.2% | 96.0% |
| Mean | 27.0% | 20.3% |
| Median | 16.1% | 11.0% |
| Interquartile 25% (IQ1) | 10.3% | 8.3% |
| Interquartile 75% (IQ3) | 38.5% | 15.7% |
| Interquartile Range (IQR) | 28.2% | 7.5% |
| Standard Deviation (Sample) | 25.7% | 23.6% |
| Standard Deviation (Population) | 25.1% | 23.1% |
Similar Demographics by Seniors Poverty Over the Age of 75
Demographics Similar to Cheyenne by Seniors Poverty Over the Age of 75
In terms of seniors poverty over the age of 75, the demographic groups most similar to Cheyenne are Immigrants from Mexico (14.9%, a difference of 0.19%), Immigrants from Central America (15.0%, a difference of 0.53%), Guatemalan (14.8%, a difference of 0.64%), Immigrants from Senegal (14.8%, a difference of 0.70%), and Belizean (14.8%, a difference of 0.88%).
| Demographics | Rating | Rank | Seniors Poverty Over the Age of 75 |
| Senegalese | 0.0 /100 | #277 | Tragic 14.5% |
| Immigrants | Colombia | 0.0 /100 | #278 | Tragic 14.6% |
| Blacks/African Americans | 0.0 /100 | #279 | Tragic 14.6% |
| Central Americans | 0.0 /100 | #280 | Tragic 14.7% |
| Belizeans | 0.0 /100 | #281 | Tragic 14.8% |
| Immigrants | Senegal | 0.0 /100 | #282 | Tragic 14.8% |
| Guatemalans | 0.0 /100 | #283 | Tragic 14.8% |
| Cheyenne | 0.0 /100 | #284 | Tragic 14.9% |
| Immigrants | Mexico | 0.0 /100 | #285 | Tragic 14.9% |
| Immigrants | Central America | 0.0 /100 | #286 | Tragic 15.0% |
| Immigrants | Guatemala | 0.0 /100 | #287 | Tragic 15.1% |
| Jamaicans | 0.0 /100 | #288 | Tragic 15.1% |
| Immigrants | Belize | 0.0 /100 | #289 | Tragic 15.2% |
| Immigrants | Azores | 0.0 /100 | #290 | Tragic 15.2% |
| Paiute | 0.0 /100 | #291 | Tragic 15.2% |
Demographics Similar to Immigrants from South Africa by Seniors Poverty Over the Age of 75
In terms of seniors poverty over the age of 75, the demographic groups most similar to Immigrants from South Africa are Immigrants from Iraq (11.5%, a difference of 0.0%), Iranian (11.5%, a difference of 0.080%), Basque (11.5%, a difference of 0.10%), Immigrants from Bulgaria (11.5%, a difference of 0.11%), and Australian (11.5%, a difference of 0.13%).
| Demographics | Rating | Rank | Seniors Poverty Over the Age of 75 |
| French Canadians | 95.7 /100 | #76 | Exceptional 11.4% |
| Whites/Caucasians | 95.5 /100 | #77 | Exceptional 11.4% |
| Macedonians | 95.5 /100 | #78 | Exceptional 11.4% |
| Filipinos | 95.5 /100 | #79 | Exceptional 11.4% |
| Alaska Natives | 95.4 /100 | #80 | Exceptional 11.4% |
| Basques | 95.1 /100 | #81 | Exceptional 11.5% |
| Iranians | 95.1 /100 | #82 | Exceptional 11.5% |
| Immigrants | South Africa | 94.9 /100 | #83 | Exceptional 11.5% |
| Immigrants | Iraq | 94.9 /100 | #84 | Exceptional 11.5% |
| Immigrants | Bulgaria | 94.7 /100 | #85 | Exceptional 11.5% |
| Australians | 94.6 /100 | #86 | Exceptional 11.5% |
| Koreans | 94.5 /100 | #87 | Exceptional 11.5% |
| Immigrants | Croatia | 94.5 /100 | #88 | Exceptional 11.5% |
| Immigrants | Sri Lanka | 94.4 /100 | #89 | Exceptional 11.5% |
| Aleuts | 94.1 /100 | #90 | Exceptional 11.5% |