Cheyenne vs Immigrants from Belize Professional Degree
COMPARE
Cheyenne
Immigrants from Belize
Professional Degree
Professional Degree Comparison
Cheyenne
Immigrants from Belize
3.6%
PROFESSIONAL DEGREE
0.5/ 100
METRIC RATING
277th/ 347
METRIC RANK
3.5%
PROFESSIONAL DEGREE
0.3/ 100
METRIC RATING
292nd/ 347
METRIC RANK
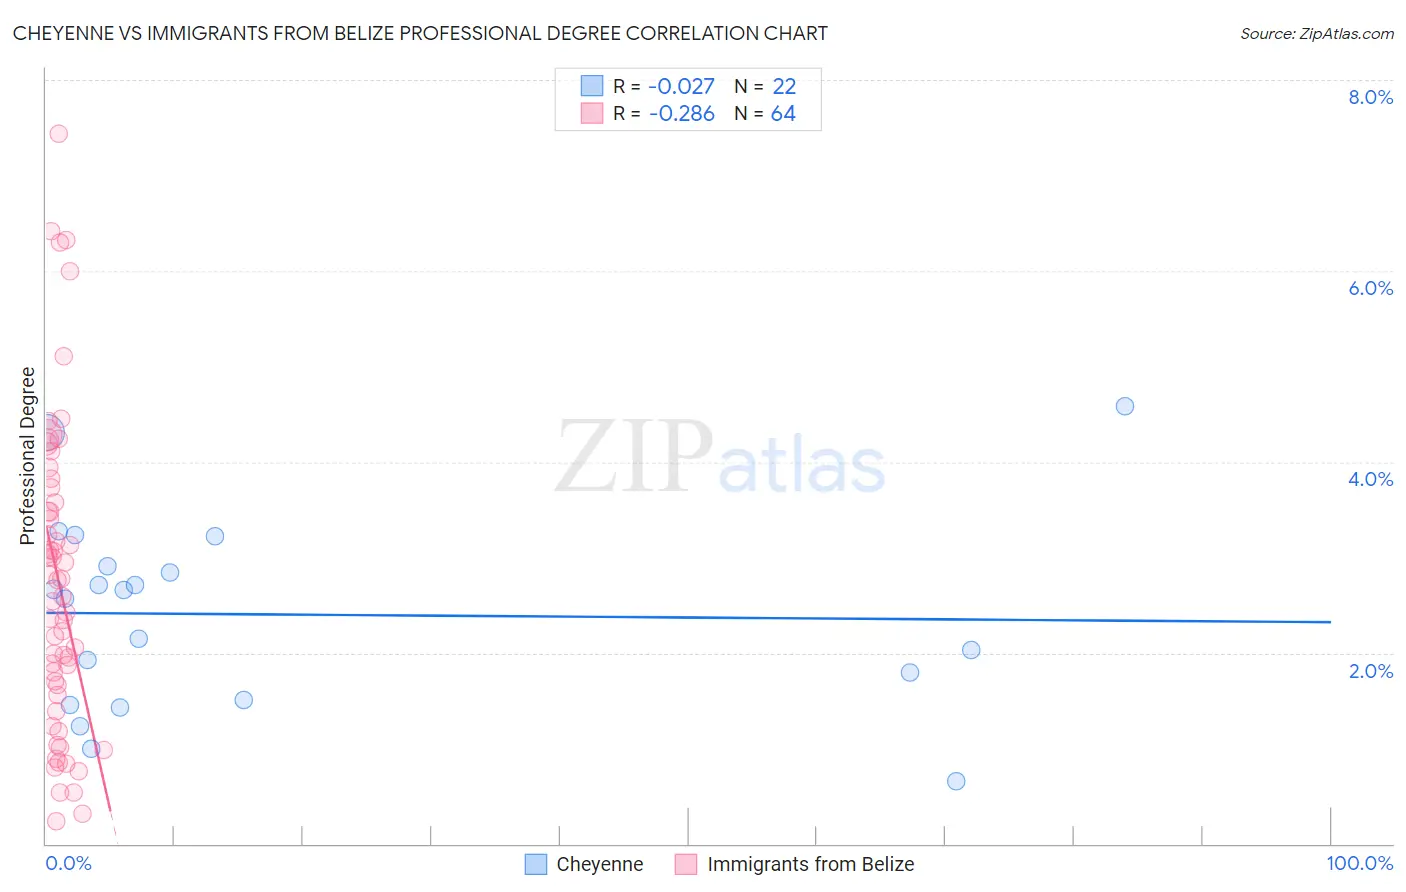
Cheyenne vs Immigrants from Belize Professional Degree Correlation Chart
The statistical analysis conducted on geographies consisting of 80,606,949 people shows no correlation between the proportion of Cheyenne and percentage of population with at least professional degree education in the United States with a correlation coefficient (R) of -0.027 and weighted average of 3.6%. Similarly, the statistical analysis conducted on geographies consisting of 130,267,931 people shows a weak negative correlation between the proportion of Immigrants from Belize and percentage of population with at least professional degree education in the United States with a correlation coefficient (R) of -0.286 and weighted average of 3.5%, a difference of 2.6%.
Professional Degree Correlation Summary
| Measurement | Cheyenne | Immigrants from Belize |
| Minimum | 0.65% | 0.23% |
| Maximum | 4.6% | 7.4% |
| Range | 3.9% | 7.2% |
| Mean | 2.4% | 2.8% |
| Median | 2.6% | 2.7% |
| Interquartile 25% (IQ1) | 1.5% | 1.6% |
| Interquartile 75% (IQ3) | 2.9% | 3.7% |
| Interquartile Range (IQR) | 1.4% | 2.0% |
| Standard Deviation (Sample) | 1.0% | 1.6% |
| Standard Deviation (Population) | 0.98% | 1.6% |
Demographics Similar to Cheyenne and Immigrants from Belize by Professional Degree
In terms of professional degree, the demographic groups most similar to Cheyenne are Liberian (3.6%, a difference of 0.010%), Immigrants from Dominica (3.6%, a difference of 0.060%), Japanese (3.5%, a difference of 0.060%), Immigrants from Portugal (3.5%, a difference of 0.10%), and Dominican (3.5%, a difference of 0.13%). Similarly, the demographic groups most similar to Immigrants from Belize are Alaska Native (3.5%, a difference of 0.070%), Chippewa (3.5%, a difference of 0.24%), Immigrants from Honduras (3.5%, a difference of 0.24%), Guatemalan (3.5%, a difference of 0.25%), and Paiute (3.4%, a difference of 0.32%).
| Demographics | Rating | Rank | Professional Degree |
| Potawatomi | 0.5 /100 | #274 | Tragic 3.6% |
| Immigrants | Dominica | 0.5 /100 | #275 | Tragic 3.6% |
| Liberians | 0.5 /100 | #276 | Tragic 3.6% |
| Cheyenne | 0.5 /100 | #277 | Tragic 3.6% |
| Japanese | 0.5 /100 | #278 | Tragic 3.5% |
| Immigrants | Portugal | 0.5 /100 | #279 | Tragic 3.5% |
| Dominicans | 0.5 /100 | #280 | Tragic 3.5% |
| Apache | 0.5 /100 | #281 | Tragic 3.5% |
| Immigrants | Caribbean | 0.5 /100 | #282 | Tragic 3.5% |
| Comanche | 0.4 /100 | #283 | Tragic 3.5% |
| Salvadorans | 0.4 /100 | #284 | Tragic 3.5% |
| Hondurans | 0.3 /100 | #285 | Tragic 3.5% |
| Haitians | 0.3 /100 | #286 | Tragic 3.5% |
| Immigrants | El Salvador | 0.3 /100 | #287 | Tragic 3.5% |
| Blackfeet | 0.3 /100 | #288 | Tragic 3.5% |
| Guatemalans | 0.3 /100 | #289 | Tragic 3.5% |
| Chippewa | 0.3 /100 | #290 | Tragic 3.5% |
| Alaska Natives | 0.3 /100 | #291 | Tragic 3.5% |
| Immigrants | Belize | 0.3 /100 | #292 | Tragic 3.5% |
| Immigrants | Honduras | 0.3 /100 | #293 | Tragic 3.5% |
| Paiute | 0.3 /100 | #294 | Tragic 3.4% |