Cherokee vs Immigrants from Northern Europe Doctorate Degree
COMPARE
Cherokee
Immigrants from Northern Europe
Doctorate Degree
Doctorate Degree Comparison
Cherokee
Immigrants from Northern Europe
1.5%
DOCTORATE DEGREE
0.3/ 100
METRIC RATING
286th/ 347
METRIC RANK
2.6%
DOCTORATE DEGREE
100.0/ 100
METRIC RATING
32nd/ 347
METRIC RANK
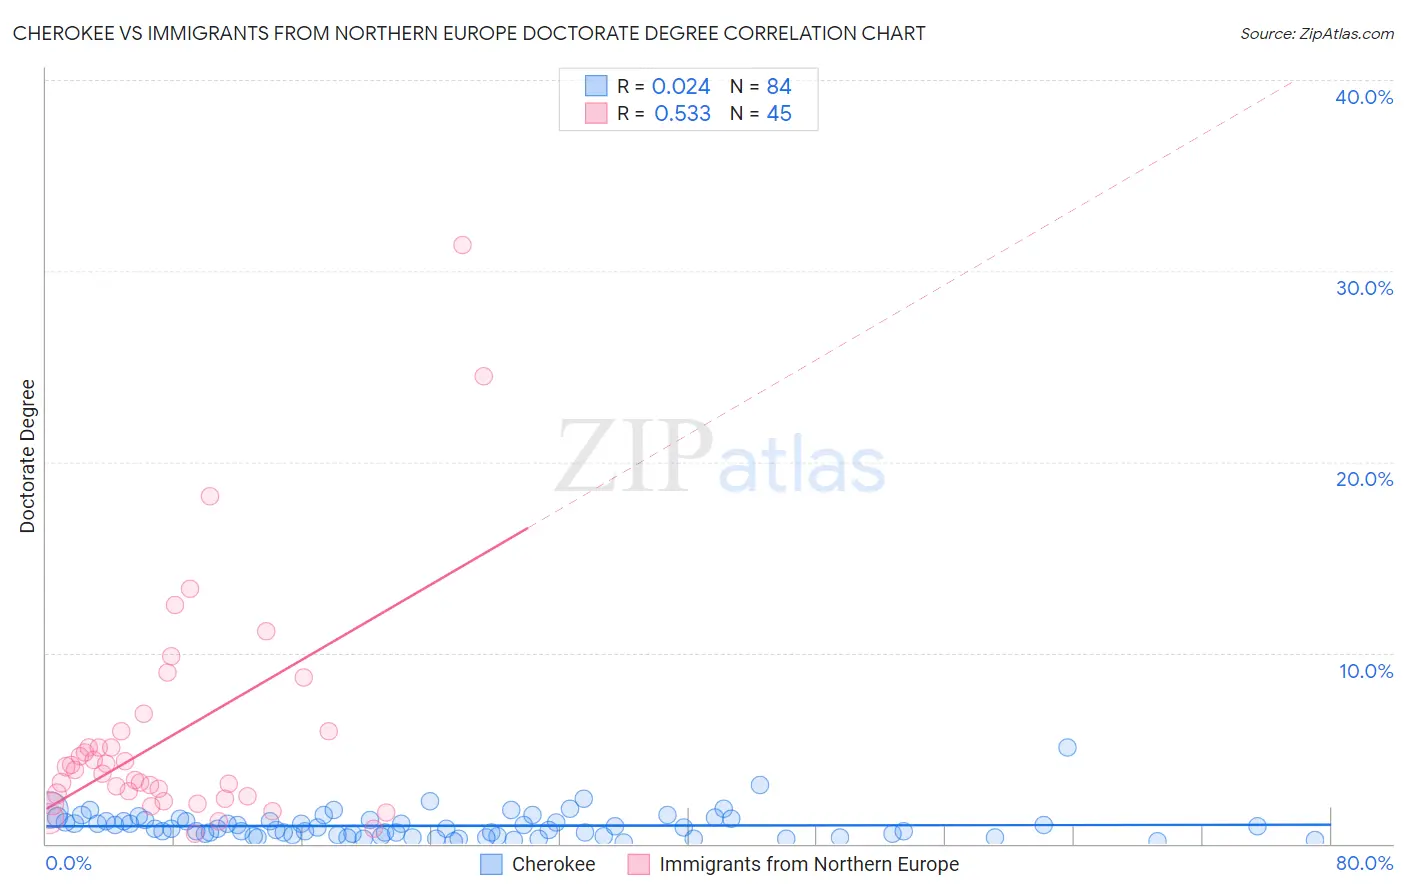
Cherokee vs Immigrants from Northern Europe Doctorate Degree Correlation Chart
The statistical analysis conducted on geographies consisting of 478,818,263 people shows no correlation between the proportion of Cherokee and percentage of population with at least doctorate degree education in the United States with a correlation coefficient (R) of 0.024 and weighted average of 1.5%. Similarly, the statistical analysis conducted on geographies consisting of 470,866,361 people shows a substantial positive correlation between the proportion of Immigrants from Northern Europe and percentage of population with at least doctorate degree education in the United States with a correlation coefficient (R) of 0.533 and weighted average of 2.6%, a difference of 77.0%.
Doctorate Degree Correlation Summary
| Measurement | Cherokee | Immigrants from Northern Europe |
| Minimum | 0.091% | 0.53% |
| Maximum | 5.0% | 31.4% |
| Range | 5.0% | 30.8% |
| Mean | 0.94% | 5.7% |
| Median | 0.81% | 3.9% |
| Interquartile 25% (IQ1) | 0.43% | 2.4% |
| Interquartile 75% (IQ3) | 1.2% | 5.9% |
| Interquartile Range (IQR) | 0.81% | 3.4% |
| Standard Deviation (Sample) | 0.73% | 6.1% |
| Standard Deviation (Population) | 0.72% | 6.0% |
Similar Demographics by Doctorate Degree
Demographics Similar to Cherokee by Doctorate Degree
In terms of doctorate degree, the demographic groups most similar to Cherokee are Cajun (1.5%, a difference of 0.17%), Malaysian (1.5%, a difference of 0.18%), Jamaican (1.5%, a difference of 0.21%), Central American (1.5%, a difference of 0.24%), and British West Indian (1.5%, a difference of 0.29%).
| Demographics | Rating | Rank | Doctorate Degree |
| Marshallese | 0.4 /100 | #279 | Tragic 1.5% |
| Ecuadorians | 0.4 /100 | #280 | Tragic 1.5% |
| Tohono O'odham | 0.4 /100 | #281 | Tragic 1.5% |
| British West Indians | 0.3 /100 | #282 | Tragic 1.5% |
| Central Americans | 0.3 /100 | #283 | Tragic 1.5% |
| Jamaicans | 0.3 /100 | #284 | Tragic 1.5% |
| Malaysians | 0.3 /100 | #285 | Tragic 1.5% |
| Cherokee | 0.3 /100 | #286 | Tragic 1.5% |
| Cajuns | 0.3 /100 | #287 | Tragic 1.5% |
| Immigrants | El Salvador | 0.3 /100 | #288 | Tragic 1.4% |
| Cape Verdeans | 0.3 /100 | #289 | Tragic 1.4% |
| Choctaw | 0.3 /100 | #290 | Tragic 1.4% |
| Blacks/African Americans | 0.3 /100 | #291 | Tragic 1.4% |
| Alaska Natives | 0.3 /100 | #292 | Tragic 1.4% |
| Immigrants | Yemen | 0.2 /100 | #293 | Tragic 1.4% |
Demographics Similar to Immigrants from Northern Europe by Doctorate Degree
In terms of doctorate degree, the demographic groups most similar to Immigrants from Northern Europe are Latvian (2.6%, a difference of 0.15%), Cambodian (2.6%, a difference of 0.17%), Cypriot (2.6%, a difference of 0.29%), Immigrants from Malaysia (2.6%, a difference of 0.35%), and Immigrants from Spain (2.6%, a difference of 0.41%).
| Demographics | Rating | Rank | Doctorate Degree |
| Immigrants | Saudi Arabia | 100.0 /100 | #25 | Exceptional 2.7% |
| Turks | 100.0 /100 | #26 | Exceptional 2.7% |
| Immigrants | Turkey | 100.0 /100 | #27 | Exceptional 2.6% |
| Burmese | 100.0 /100 | #28 | Exceptional 2.6% |
| Immigrants | South Central Asia | 100.0 /100 | #29 | Exceptional 2.6% |
| Immigrants | Korea | 100.0 /100 | #30 | Exceptional 2.6% |
| Latvians | 100.0 /100 | #31 | Exceptional 2.6% |
| Immigrants | Northern Europe | 100.0 /100 | #32 | Exceptional 2.6% |
| Cambodians | 100.0 /100 | #33 | Exceptional 2.6% |
| Cypriots | 100.0 /100 | #34 | Exceptional 2.6% |
| Immigrants | Malaysia | 100.0 /100 | #35 | Exceptional 2.6% |
| Immigrants | Spain | 100.0 /100 | #36 | Exceptional 2.6% |
| Immigrants | Kuwait | 100.0 /100 | #37 | Exceptional 2.6% |
| Russians | 100.0 /100 | #38 | Exceptional 2.6% |
| Immigrants | Ireland | 100.0 /100 | #39 | Exceptional 2.5% |