Central American vs Subsaharan African Female Poverty Among 18-24 Year Olds
COMPARE
Central American
Subsaharan African
Female Poverty Among 18-24 Year Olds
Female Poverty Among 18-24 Year Olds Comparison
Central Americans
Sub-Saharan Africans
19.9%
FEMALE POVERTY AMONG 18-24 YEAR OLDS
70.0/ 100
METRIC RATING
164th/ 347
METRIC RANK
22.0%
FEMALE POVERTY AMONG 18-24 YEAR OLDS
0.0/ 100
METRIC RATING
283rd/ 347
METRIC RANK
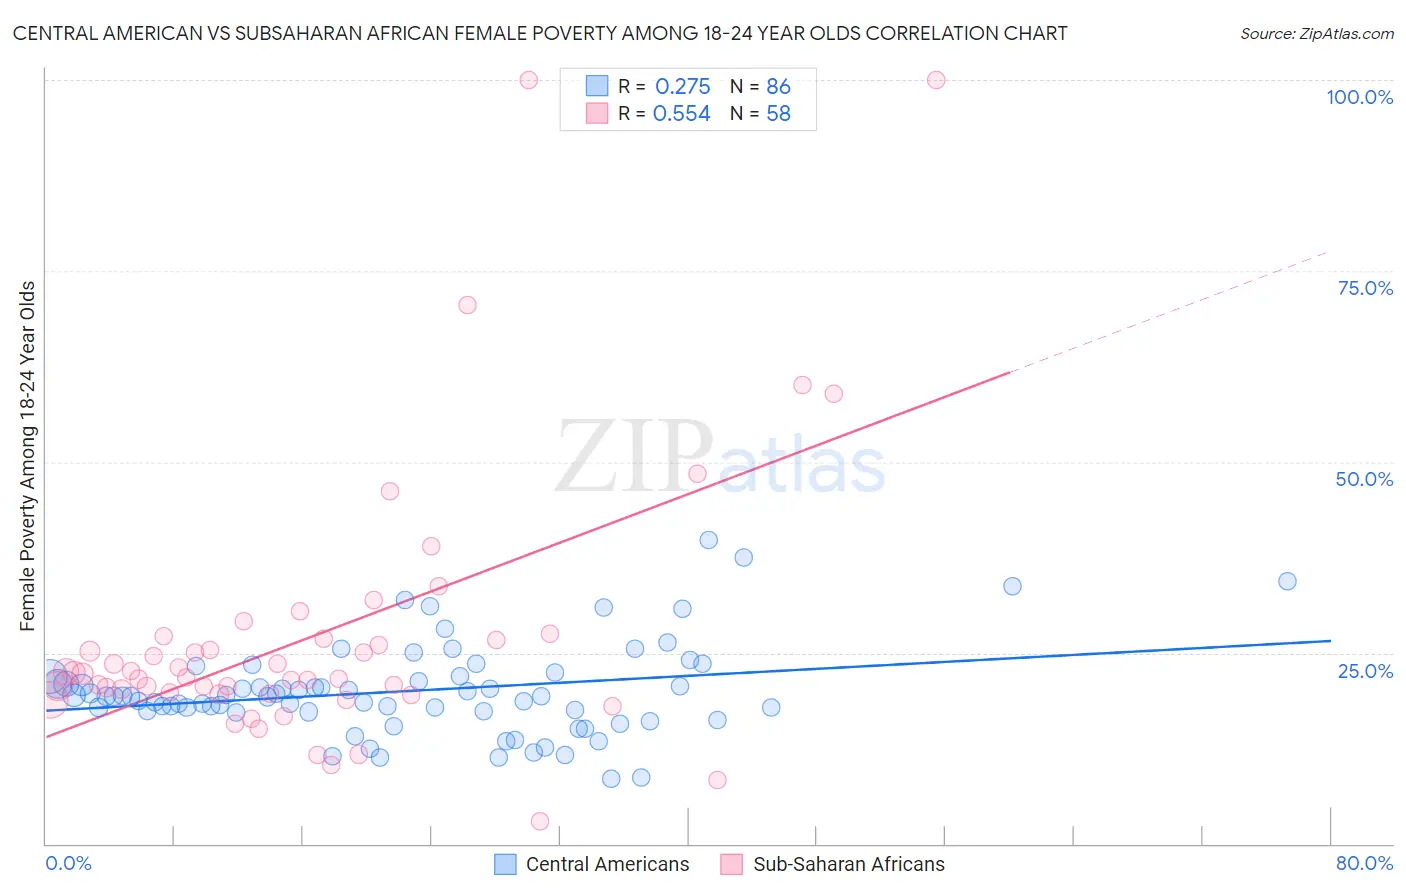
Central American vs Subsaharan African Female Poverty Among 18-24 Year Olds Correlation Chart
The statistical analysis conducted on geographies consisting of 487,103,061 people shows a weak positive correlation between the proportion of Central Americans and poverty level among females between the ages 18 and 24 in the United States with a correlation coefficient (R) of 0.275 and weighted average of 19.9%. Similarly, the statistical analysis conducted on geographies consisting of 491,266,665 people shows a substantial positive correlation between the proportion of Sub-Saharan Africans and poverty level among females between the ages 18 and 24 in the United States with a correlation coefficient (R) of 0.554 and weighted average of 22.0%, a difference of 10.7%.
Female Poverty Among 18-24 Year Olds Correlation Summary
| Measurement | Central American | Subsaharan African |
| Minimum | 8.5% | 3.0% |
| Maximum | 39.8% | 100.0% |
| Range | 31.3% | 97.0% |
| Mean | 20.0% | 27.3% |
| Median | 19.3% | 22.0% |
| Interquartile 25% (IQ1) | 17.3% | 19.6% |
| Interquartile 75% (IQ3) | 21.9% | 26.9% |
| Interquartile Range (IQR) | 4.6% | 7.3% |
| Standard Deviation (Sample) | 5.9% | 18.2% |
| Standard Deviation (Population) | 5.9% | 18.1% |
Similar Demographics by Female Poverty Among 18-24 Year Olds
Demographics Similar to Central Americans by Female Poverty Among 18-24 Year Olds
In terms of female poverty among 18-24 year olds, the demographic groups most similar to Central Americans are Eastern European (19.9%, a difference of 0.040%), Belgian (19.9%, a difference of 0.050%), Malaysian (19.9%, a difference of 0.16%), French Canadian (19.9%, a difference of 0.19%), and Immigrants from Belize (19.8%, a difference of 0.25%).
| Demographics | Rating | Rank | Female Poverty Among 18-24 Year Olds |
| Danes | 75.5 /100 | #157 | Good 19.8% |
| Immigrants | Lebanon | 75.3 /100 | #158 | Good 19.8% |
| Trinidadians and Tobagonians | 74.4 /100 | #159 | Good 19.8% |
| Pakistanis | 74.1 /100 | #160 | Good 19.8% |
| Immigrants | Belize | 74.1 /100 | #161 | Good 19.8% |
| French Canadians | 73.0 /100 | #162 | Good 19.9% |
| Malaysians | 72.7 /100 | #163 | Good 19.9% |
| Central Americans | 70.0 /100 | #164 | Good 19.9% |
| Eastern Europeans | 69.3 /100 | #165 | Good 19.9% |
| Belgians | 69.1 /100 | #166 | Good 19.9% |
| Czechoslovakians | 61.8 /100 | #167 | Good 20.0% |
| Fijians | 59.1 /100 | #168 | Average 20.0% |
| Hmong | 55.4 /100 | #169 | Average 20.0% |
| Iranians | 54.7 /100 | #170 | Average 20.1% |
| Immigrants | Nigeria | 54.3 /100 | #171 | Average 20.1% |
Demographics Similar to Sub-Saharan Africans by Female Poverty Among 18-24 Year Olds
In terms of female poverty among 18-24 year olds, the demographic groups most similar to Sub-Saharan Africans are Tlingit-Haida (22.0%, a difference of 0.010%), Ottawa (22.0%, a difference of 0.13%), Bermudan (21.9%, a difference of 0.30%), Ugandan (22.1%, a difference of 0.32%), and Immigrants from Middle Africa (22.1%, a difference of 0.33%).
| Demographics | Rating | Rank | Female Poverty Among 18-24 Year Olds |
| Bahamians | 0.1 /100 | #276 | Tragic 21.8% |
| Immigrants | Switzerland | 0.1 /100 | #277 | Tragic 21.8% |
| Yaqui | 0.1 /100 | #278 | Tragic 21.9% |
| Spanish Americans | 0.1 /100 | #279 | Tragic 21.9% |
| Immigrants | Dominica | 0.1 /100 | #280 | Tragic 21.9% |
| Immigrants | Dominican Republic | 0.1 /100 | #281 | Tragic 21.9% |
| Bermudans | 0.1 /100 | #282 | Tragic 21.9% |
| Sub-Saharan Africans | 0.0 /100 | #283 | Tragic 22.0% |
| Tlingit-Haida | 0.0 /100 | #284 | Tragic 22.0% |
| Ottawa | 0.0 /100 | #285 | Tragic 22.0% |
| Ugandans | 0.0 /100 | #286 | Tragic 22.1% |
| Immigrants | Middle Africa | 0.0 /100 | #287 | Tragic 22.1% |
| Dominicans | 0.0 /100 | #288 | Tragic 22.3% |
| French American Indians | 0.0 /100 | #289 | Tragic 22.3% |
| Immigrants | Senegal | 0.0 /100 | #290 | Tragic 22.4% |