Central American vs Immigrants from Uzbekistan Female Poverty Among 18-24 Year Olds
COMPARE
Central American
Immigrants from Uzbekistan
Female Poverty Among 18-24 Year Olds
Female Poverty Among 18-24 Year Olds Comparison
Central Americans
Immigrants from Uzbekistan
19.9%
FEMALE POVERTY AMONG 18-24 YEAR OLDS
70.0/ 100
METRIC RATING
164th/ 347
METRIC RANK
19.2%
FEMALE POVERTY AMONG 18-24 YEAR OLDS
97.3/ 100
METRIC RATING
108th/ 347
METRIC RANK
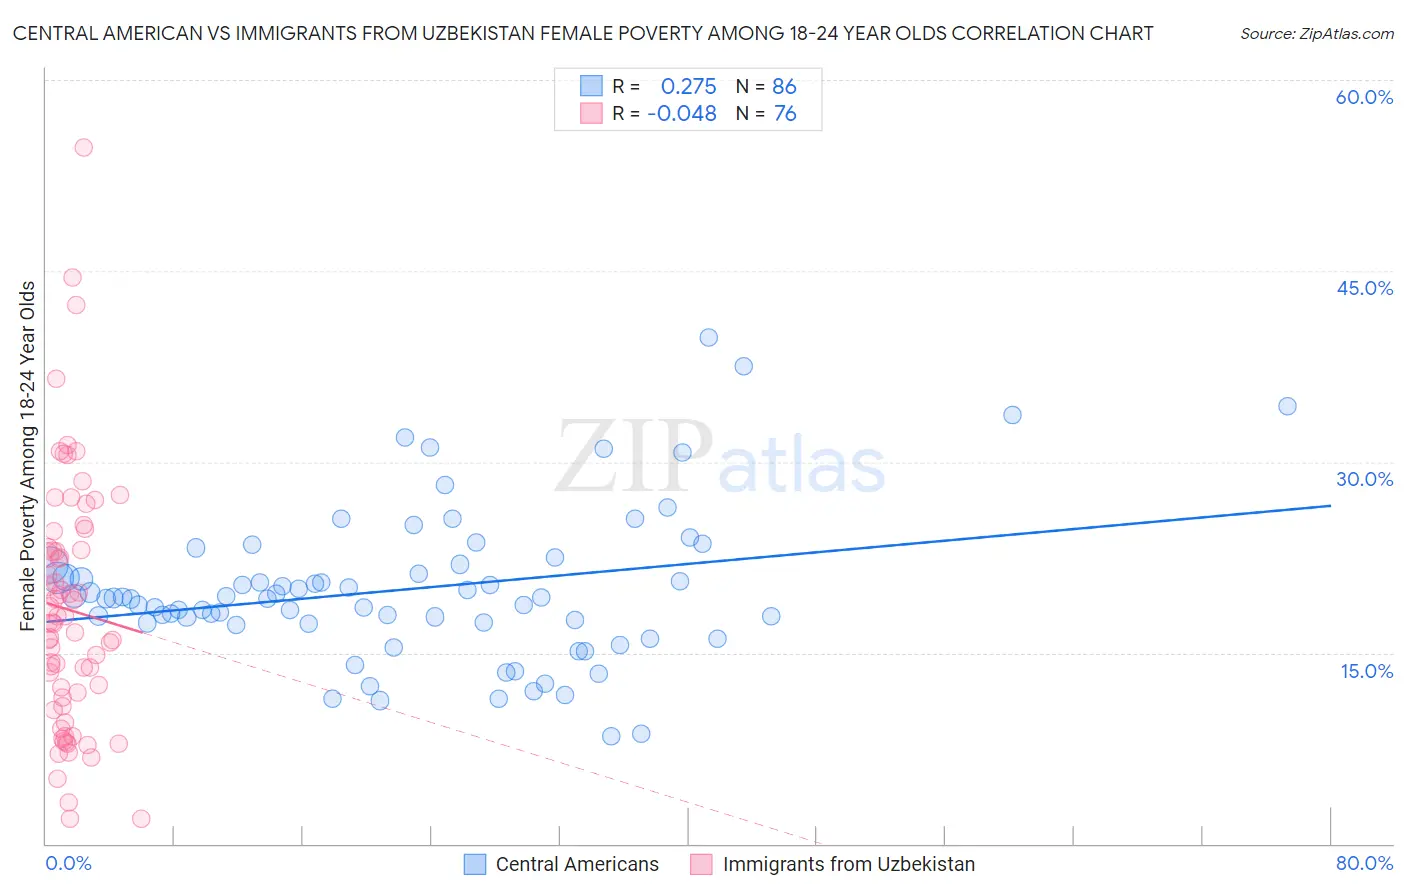
Central American vs Immigrants from Uzbekistan Female Poverty Among 18-24 Year Olds Correlation Chart
The statistical analysis conducted on geographies consisting of 487,103,061 people shows a weak positive correlation between the proportion of Central Americans and poverty level among females between the ages 18 and 24 in the United States with a correlation coefficient (R) of 0.275 and weighted average of 19.9%. Similarly, the statistical analysis conducted on geographies consisting of 117,709,587 people shows no correlation between the proportion of Immigrants from Uzbekistan and poverty level among females between the ages 18 and 24 in the United States with a correlation coefficient (R) of -0.048 and weighted average of 19.2%, a difference of 3.5%.
Female Poverty Among 18-24 Year Olds Correlation Summary
| Measurement | Central American | Immigrants from Uzbekistan |
| Minimum | 8.5% | 2.0% |
| Maximum | 39.8% | 54.7% |
| Range | 31.3% | 52.8% |
| Mean | 20.0% | 18.4% |
| Median | 19.3% | 17.4% |
| Interquartile 25% (IQ1) | 17.3% | 11.2% |
| Interquartile 75% (IQ3) | 21.9% | 23.2% |
| Interquartile Range (IQR) | 4.6% | 12.0% |
| Standard Deviation (Sample) | 5.9% | 9.8% |
| Standard Deviation (Population) | 5.9% | 9.8% |
Similar Demographics by Female Poverty Among 18-24 Year Olds
Demographics Similar to Central Americans by Female Poverty Among 18-24 Year Olds
In terms of female poverty among 18-24 year olds, the demographic groups most similar to Central Americans are Eastern European (19.9%, a difference of 0.040%), Belgian (19.9%, a difference of 0.050%), Malaysian (19.9%, a difference of 0.16%), French Canadian (19.9%, a difference of 0.19%), and Immigrants from Belize (19.8%, a difference of 0.25%).
| Demographics | Rating | Rank | Female Poverty Among 18-24 Year Olds |
| Danes | 75.5 /100 | #157 | Good 19.8% |
| Immigrants | Lebanon | 75.3 /100 | #158 | Good 19.8% |
| Trinidadians and Tobagonians | 74.4 /100 | #159 | Good 19.8% |
| Pakistanis | 74.1 /100 | #160 | Good 19.8% |
| Immigrants | Belize | 74.1 /100 | #161 | Good 19.8% |
| French Canadians | 73.0 /100 | #162 | Good 19.9% |
| Malaysians | 72.7 /100 | #163 | Good 19.9% |
| Central Americans | 70.0 /100 | #164 | Good 19.9% |
| Eastern Europeans | 69.3 /100 | #165 | Good 19.9% |
| Belgians | 69.1 /100 | #166 | Good 19.9% |
| Czechoslovakians | 61.8 /100 | #167 | Good 20.0% |
| Fijians | 59.1 /100 | #168 | Average 20.0% |
| Hmong | 55.4 /100 | #169 | Average 20.0% |
| Iranians | 54.7 /100 | #170 | Average 20.1% |
| Immigrants | Nigeria | 54.3 /100 | #171 | Average 20.1% |
Demographics Similar to Immigrants from Uzbekistan by Female Poverty Among 18-24 Year Olds
In terms of female poverty among 18-24 year olds, the demographic groups most similar to Immigrants from Uzbekistan are Immigrants from Syria (19.2%, a difference of 0.080%), Immigrants from Sri Lanka (19.2%, a difference of 0.090%), Laotian (19.2%, a difference of 0.11%), Immigrants from Serbia (19.2%, a difference of 0.12%), and Immigrants from Sierra Leone (19.2%, a difference of 0.24%).
| Demographics | Rating | Rank | Female Poverty Among 18-24 Year Olds |
| Ecuadorians | 98.1 /100 | #101 | Exceptional 19.1% |
| Immigrants | Caribbean | 98.1 /100 | #102 | Exceptional 19.1% |
| Serbians | 98.0 /100 | #103 | Exceptional 19.1% |
| Immigrants | Afghanistan | 98.0 /100 | #104 | Exceptional 19.1% |
| Immigrants | Ecuador | 97.8 /100 | #105 | Exceptional 19.2% |
| Immigrants | Sierra Leone | 97.8 /100 | #106 | Exceptional 19.2% |
| Immigrants | Sri Lanka | 97.5 /100 | #107 | Exceptional 19.2% |
| Immigrants | Uzbekistan | 97.3 /100 | #108 | Exceptional 19.2% |
| Immigrants | Syria | 97.2 /100 | #109 | Exceptional 19.2% |
| Laotians | 97.1 /100 | #110 | Exceptional 19.2% |
| Immigrants | Serbia | 97.1 /100 | #111 | Exceptional 19.2% |
| Immigrants | El Salvador | 96.5 /100 | #112 | Exceptional 19.3% |
| Immigrants | Cameroon | 96.3 /100 | #113 | Exceptional 19.3% |
| Slovenes | 96.2 /100 | #114 | Exceptional 19.3% |
| Immigrants | Hungary | 96.2 /100 | #115 | Exceptional 19.3% |